On Monday, the major stock market indices attempted a reversal of Friday’s price action but failed. This created another late-day selloff.
Does this mean we should prepare ourselves for another move lower or does the market have support to lean on through the coming week?
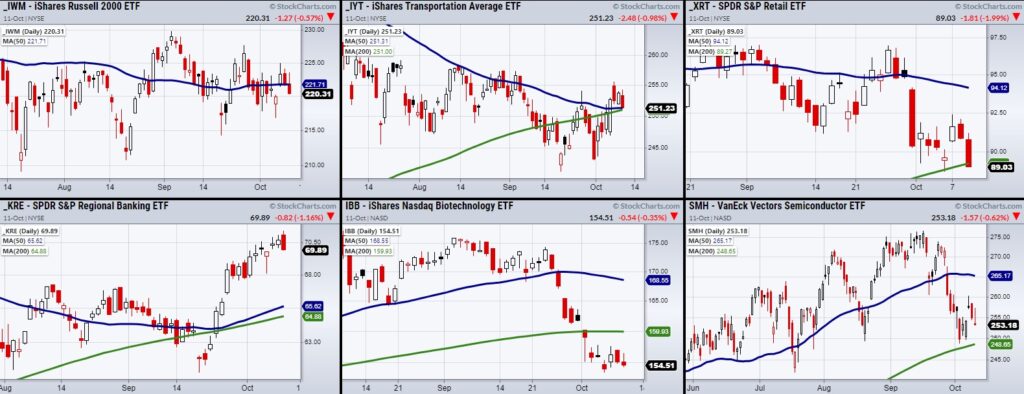
To get a quick but in-depth market picture, we like to use Mish’s Economic Modern Family which consists of 5 key sectors and one major index.
Starting with the Russell 2000 (IWM), it is holding between recent support at $216.76 and resistance at $224.95.
Taking a closer look at IWM, its range looks to be shrinking as the price has become tighter over the past month.
Although tight consolidation can lead to major moves, IWM has yet to consolidate near the high or low of its range making it tough to predict.
Moving on, though the regional banking sector (KRE) closed red on Monday, it is still the strongest leading Family member sitting in an uptrend with a positive slopped 50-DMA.
On the other hand, Biotech (IBB) is the weakest of the bunch. Sitting under its 200-Day moving average at $160.10, IBB has minor support from recent lows at $153.38. However, IBB could be interesting if it clears its recent consolidation area at $157.77 and holds that price level.
Other sectors while not as weak as biotech are beginning to break down.
For instance, Transportation (IYT) and the Retail sector (XRT) both closed underneath major moving averages. IYT closed under its 50-DMA at $251.31 and XRT under the 200-DMA at $89.27.
However, since price action can be choppy, we should watch for each to confirm a second day’s close under the moving averages.
The last sector is semiconductors (SMH). Heavily correlated with the tech sector, SMH has major support to hold from its 200-DMA at 248.65.
Another thing to note is that we are now heading into earning season.
This could boost or weaken the market as investors are watching for increased performance and growth from pandemic lows.
Having said that, we need to keep an eye on these 6 members to hold over recent support and in the case of IYT and XRT, get back over their major moving averages as seen on the above charts.
Watch Mish’s latest appearance on TD Ameritrade!
Stock Market ETFs Trading Analysis & Summary:
S&P 500 (SPY) Resistance 442 area. Watching to hold over 434.
Russell 2000 (IWM) Tight consolidation in its range. Support 216.76.
Dow Jones Industrials (DIA) 350 resistance.
Nasdaq (QQQ) 350 next support.
KRE (Regional Banks) Created a bearish engulfing pattern. Needs to get back over 70.
SMH (Semiconductors) Needs a close over the 10-DMA at 255.23.
IYT (Transportation) Broke the 50-DMA at 251.31.
IBB (Biotechnology) 153.38 support.
XRT (Retail) A second close under the 200-DMA at 89.27 will confirm a distribution phase.
Twitter: @marketminute
The author may have a position in mentioned securities at the time of publication. Any opinions expressed herein are solely those of the author and do not represent the views or opinions of any other person or entity.


")