The past several weeks have seen many commodities take a breather from their near vertical ascent.
This is welcome news for many consumers that have been wondering when gas and food prices will stop rising… and perhaps come back down a bit.
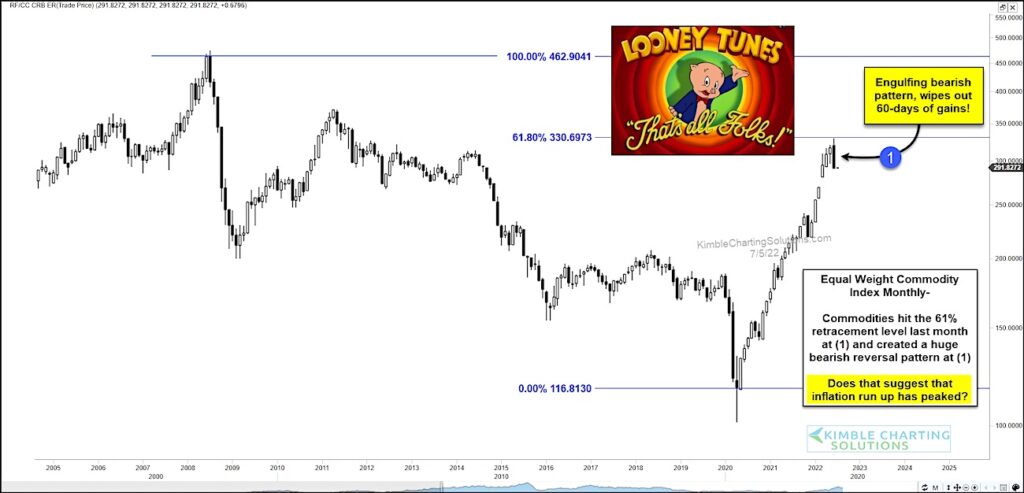
Today, we look at a “hopeful” chart. It’s a long-term “monthly” chart of the Equal Weight Commodity Index.
As you can see, the commodities rally hit the 61.8% fibonacci retracement level last month at (1) and created a HUGE bearish reversal pattern. The reversal also formed an engulfing pattern that wiped out 60 days of gains! This underscores the importance of Fibonacci price levels and why we watch them.
Could this be suggesting that inflation has peaked? Stay tuned!
Equal Weight Commodity Index “monthly” Chart
Note that KimbleCharting is offering a 2 week Free trial to See It Market readers. Just send me an email to services@kimblechartingsolutions.com for details to get set up.
Twitter: @KimbleCharting
Any opinions expressed herein are solely those of the author, and do not in any way represent the views or opinions of any other person or entity.


