We’ve been watching the e-mini NASDAQ 100 futures (NQ) price as it forms what might be a completed structure up from the first week of March. This could mark the penultimate high in the long ascent from more than a decade ago.
Roughly speaking, the Nasdaq 100 futures and Nasdaq 100 ETF (NASDAQ: QQQ) have been following the Elliott wave projection we offered earlier this year for the SPDR Dow Jones Industrial Average ETF (DIA), with the climb from spring 2020 losing momentum in what we expected would be an ending diagonal pattern.
As with DIA, we believe a diagonal describes the internal structure of the fifth and final Elliott wave pattern segment in the (i)-(ii)-(iii)-(iv)-(v) sequence up from 2020. Right now we are interested in counting the progress of the waves internal to segment (v). There should be five of them, and each should consist of three sub-waves.
Nasdaq futures (NQ) price is now testing the Fibonacci-based resistance area at 14105, and the expected set of three sub-waves up from March 2021 appears complete. That suggests a retracement should begin soon as wave iv of the i-ii-iii-iv-v sequence, with one more high expected in summer or autumn.
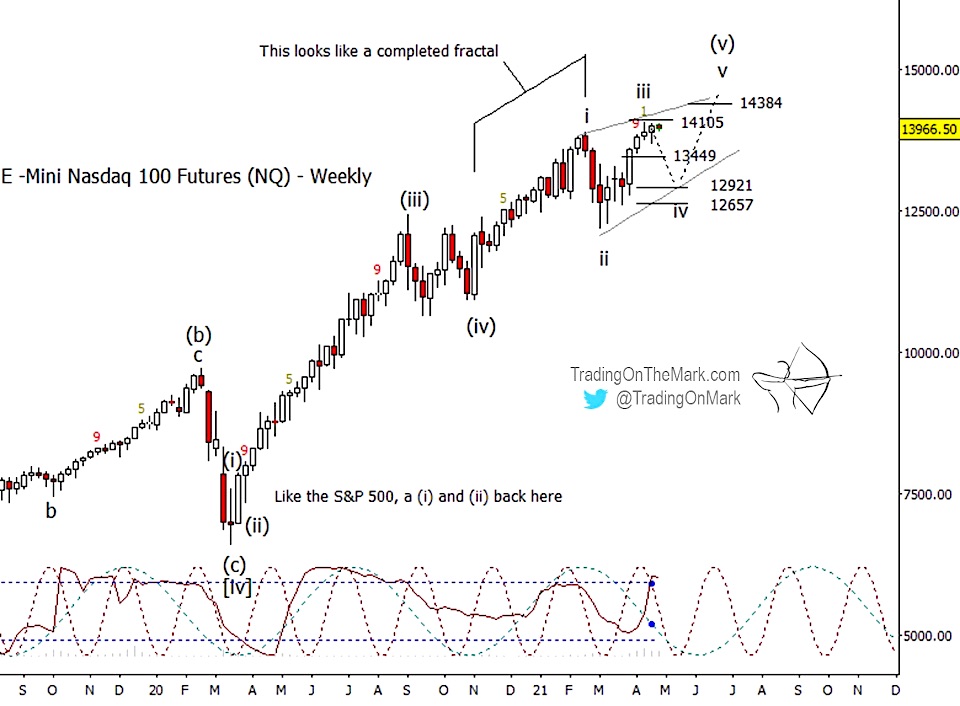
If NQ reverses from nearby, then watch for downward wave iv to reach for supports at 12921 or possibly 12657. Prior resistance at 13449 could also act as a “stepping stone” support along the way, perhaps marking the end of sub-wave [A] of iv.
On a larger scale, there is a good chance the expected high later this year will remain as a landmark on the chart for many years to come. In the same way we have been watching for sets of five waves to complete pattern segments on the weekly chart above, the long climb up from 2009 is approaching what should be the completion of a [i]-[ii]-[iii]-iv]-[v] Elliott wave sequence.
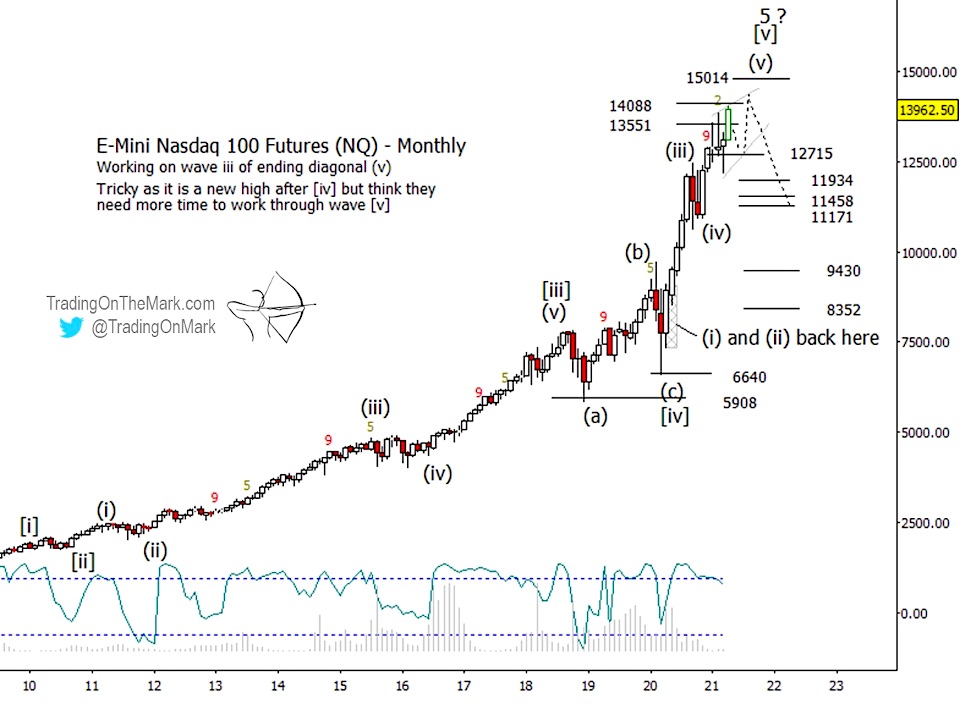
Big-picture resistance based on monthly candles resides nearby at 14088 and also at 15014. Typically we watch the areas of big-picture resistance while fine-tuning our projections on faster charts, as with the weekly chart shown earlier.
Trading On The Mark provides detailed, nuanced analysis for a wide range of markets including crude oil, the S&P 500, currencies, gold, and treasuries. Sign up for free market updates via our new page on Substack and follow us on Twitter for more charts.
Twitter: @TradingOnMark
The authors may have a position in the mentioned securities at the time of publication. Any opinions expressed herein are solely those of the author, and do not in any way represent the views or opinions of any other person or entity.
 Ready To Break Out?")


 Rolling Over At Key Fibonacci Level?")

 Ready To Break Out?")