On January 1 of this year, the S&P 500 had just completed 2017 which enjoyed record operating earnings of $124.50.
With just one quarter to go, if current estimates hold for the final quarter, the S&P 500 will set another record of $157.70 in earnings for 2018, an increase of 27%!!
Forecasts for 2019 are for $174.40. That would set yet another record, albeit with a more tepid growth rate, but still pretty impressive.
Yet given the current stock market correction, the S&P 500 index is sitting around 2,640 (at the time of writing), about the same level as at the start of the year. When earnings (E) rise and prices (P) stay flat, well do the math, valuations (P/E) fall.
Multiple compression has offset all the positive benefits of earnings growth and dividends so far in 2018. The chart below is the total return decomposition of the S&P 500 for each of the last twenty calendar years. The orange horizontal line shows each year’s total return and is decomposed into dividends, earnings growth and the change in the valuation multiple (Multiple Chng).
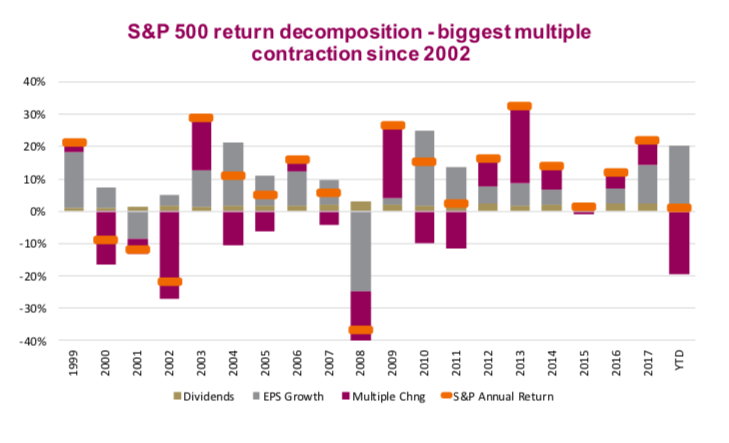
At this point, the negative contribution from the change in the markets’ P/E ratio is the biggest since 2002, even bigger than 2008. The P/E ratio has dropped from 18.2x forward consensus earnings to 15.1x.
The market multiple or P/E ratio is a fickle number. It incorporates expectations about where things are going, is often sensitive to changing bond yields and captures the overall market sentiment or confidence. From a market performance perspective, sometimes it giveth and sometimes it taketh. So far in 2018, it has been a big taker. But remember the market multiple contribution in the long-term is a zero-sum game and often, a big negative contribution is followed by a large positive one.
Buy Canada?
There is a long list of reasons to be cautious on Canadian equities. Our economy is very levered to the housing industry, global economic growth is slowing, our consumers are heavily levered and once again we are squandering our natural resources, as Canadian oil is fetching low prices due to infrastructure impasses. Not to mention, all oil prices are falling fast. But how much of this is already ‘baked in’ to the valuations?
The P/E multiple for the TSX has actually fallen more than the U.S., from 17x two years ago down to 13.1x today. Applying the same return-decomposition framework to the TSX, our multiple has fallen about the same so far in 2018, but we did not enjoy as robust earnings growth as the U.S. Add it up and our index is down 7% this year.
We would point out from the top chart that valuations between Canada and the U.S. tend to move together and are usually very close…most of the time.
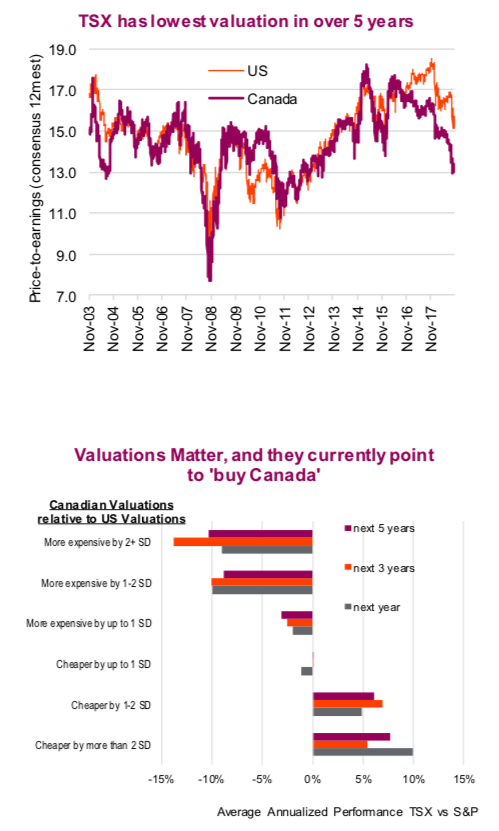
Does this recent spread mean Canada is the place to look? Perhaps. We ran an analysis on the historical P/E ratio spread between Canada and the U.S. over the past two decades, measuring subsequent index performance. The TSX underperformed materially following periods when the TSX was more expensive than the S&P 500 by 1-2 or 2+ standard deviations. Conversely, the TSX tended to outperform the S&P 500 when the TSX was 1-2 or 2+ standard deviations cheaper. For a reference point, we are currently poised on the cusp, just a hair under being cheaper by a full 2 standard deviations.
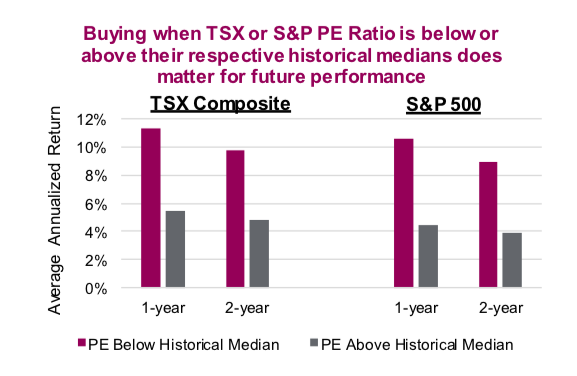
Valuations are relatively useless for picking market tops or bottoms. However, for longer-term focused investing they can provide more advantageous entry points. Just look at the disparity of average 1- and 2-year returns for the TSX and S&P 500 based on entry points that were above or below historical median valuations. The difference in average subsequent performance is rather stark.
The next chart is the average return for the TSX and S&P 500, if you purchased when the P/E ratio was below or above its historical median. The analysis for the TSX is based on 1994 to the present; for the S&P 500, it is from 1934 to today. Clearly valuations do matter for expected returns. The good news is the TSX is below its historical median and the S&P 500 is getting really close.
Now we are not rushing out the door to buy Canada but given the rise of the U.S. dollar plus the valuation gap, Canada is starting to look rather compelling.
Charts are sourced to Bloomberg unless otherwise noted.
Twitter: @ConnectedWealth
Any opinions expressed herein are solely those of the authors, and do not in any way represent the views or opinions of any other person or entity.


