Below are six charts to help you decide if inflation or inflation expectations are moving materially lower.
If not, is inflation the Trojan horse that allows the Fed to lower rates despite any reasonable rationale?
Note that all of the data for the graphs below are sourced from Bloomberg.
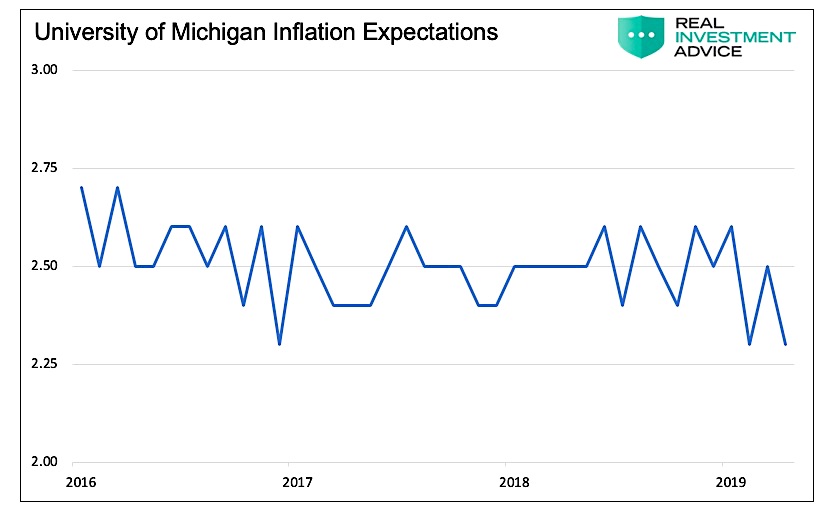
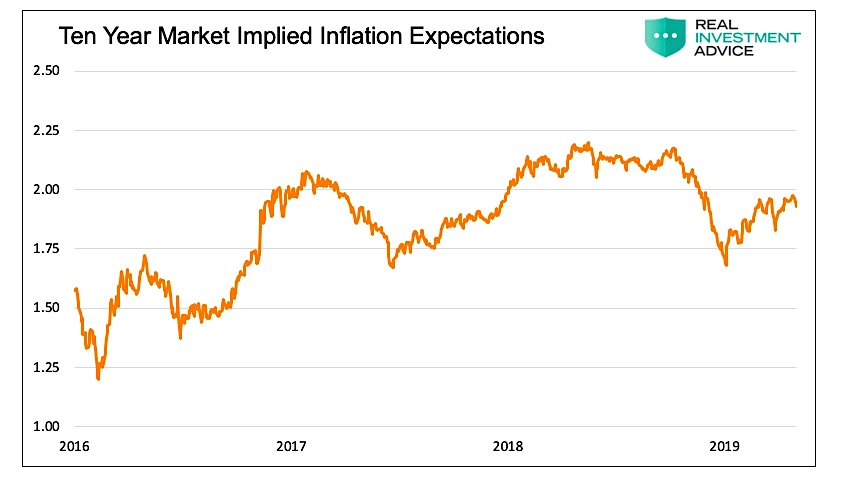
Inflation Expectations
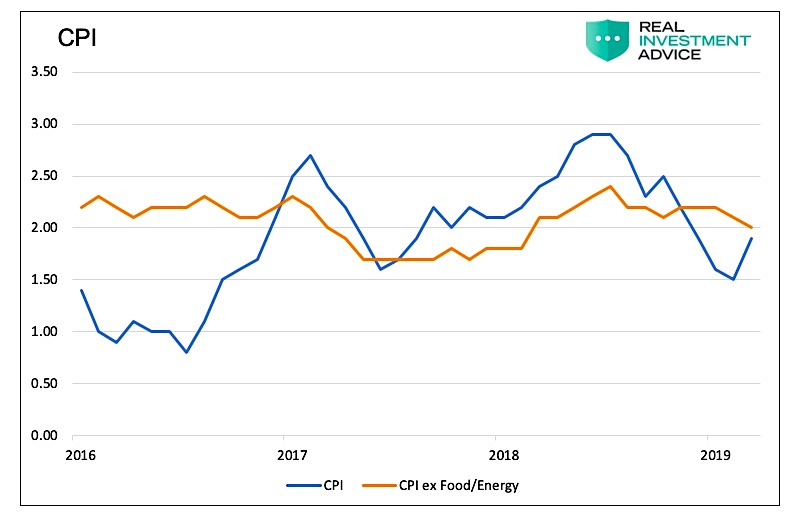
Standard Inflation Measurements
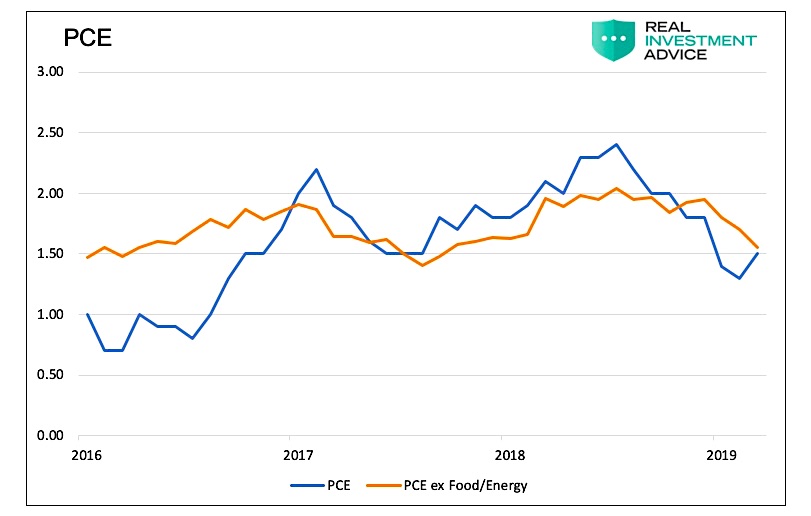
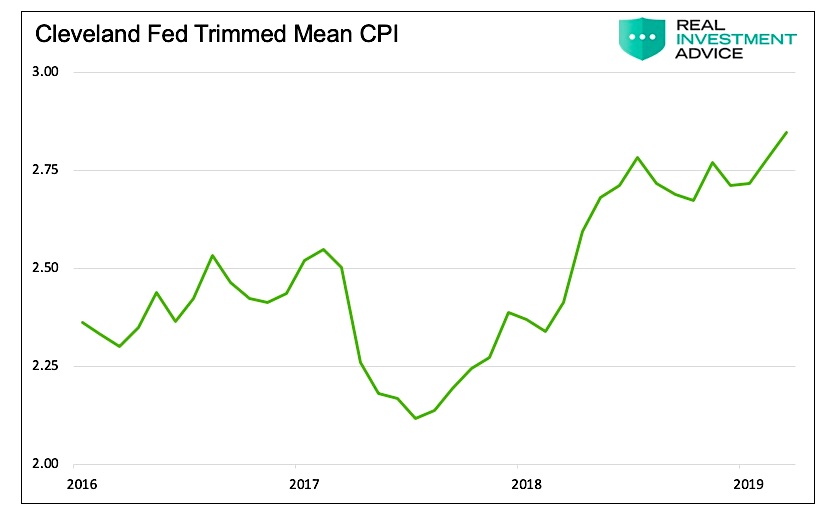
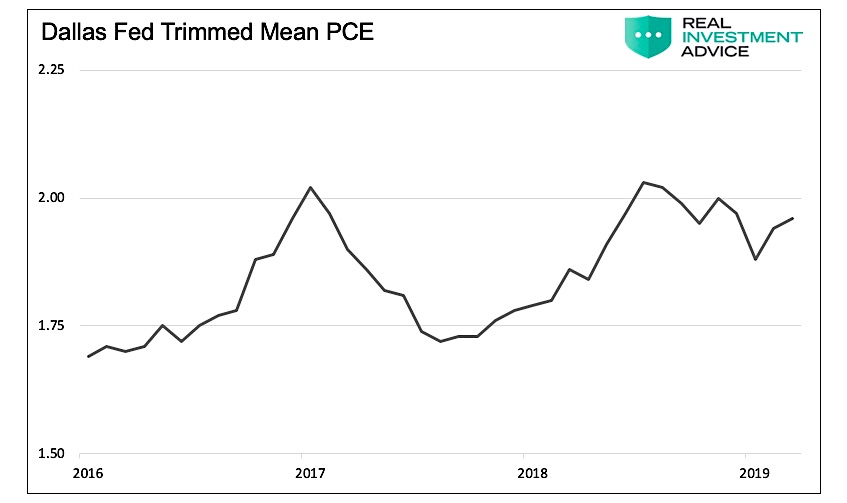
Fed’s Own Inflation Measures
The following two graphs are inflation indicators that the Fed created. They are designed to reduce temporary blips in the prices of all goods and services within the CPI and GDP reports. The Federal Reserve believes these measures present a more durable reading that is not as subject to transitory forces as other inflation measures.
Summary
Have inflation“expectations drift(ed) materially up or down?”
Looking at the ebbs and flows of inflation and inflation expectations of the last three years, we see no consistent change in the trend. As for the dreaded fear of deflation, the United States has not experienced it since the Great Drepression in the 1930’s.
In my opinion, this recent talk about lower inflation is a sad case of the Fed manufacturing a story to justify easier monetary policy.
I conclude with a message for the Federal Reserve- If you want to lower rates then lower rates, but please do not feign concern about inflation trends that are non-existent as cover for such moves. You preach transparency, so be transparent.
Twitter: @michaellebowitz
Any opinions expressed herein are solely those of the author, and do not in any way represent the views or opinions of any other person or entity.
 Rolling Over At Key Fibonacci Level?")


 Rolling Over At Key Fibonacci Level?")

