Today vs. June 27…A Stark Contrast
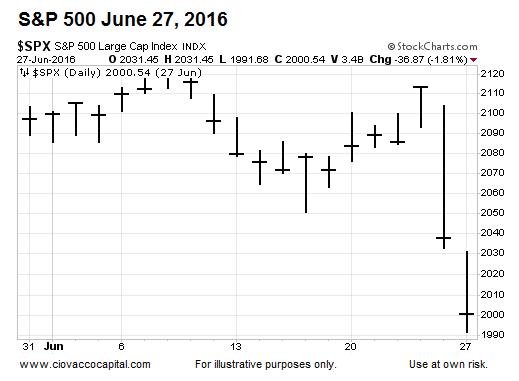
In this post we will compare the evidence we had in hand four days after the Brexit referendum in the United Kingdom to the present day. The Brexit vote took place on Thursday, June 23; four days later was Monday, June 27 (shown below).
This Is What A Higher Risk Market Looks Like
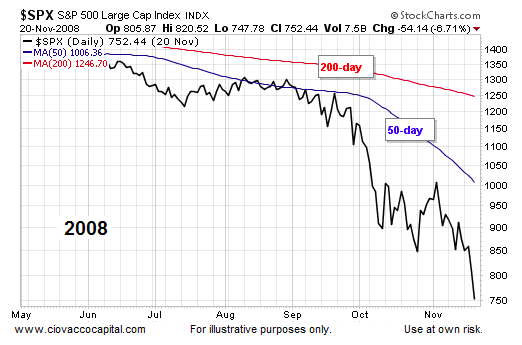
If we understand what a high risk market looks like, we can learn something about the present day market’s risk-reward profile. When the bears are in full control of the market, there are several key elements that are observable:
- Price drops below both the 50-day and 200-day moving averages (see chart below).
- The 50-day is below the 200-day.
- The 50-day and 200-day have negative slopes.
The concepts can be applied to any timeframe or set of moving averages. All things being equal, the probability of good things happening is higher when price is above a moving average and the slope of the moving average is positive. All things being equal, the probability of bad things happening is higher when price is below a moving average and the slope of the moving average is negative.
The 10-Day Moving Average
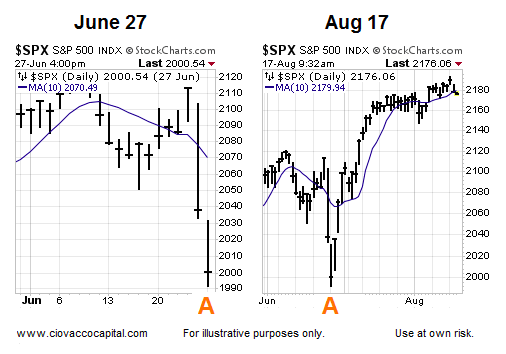
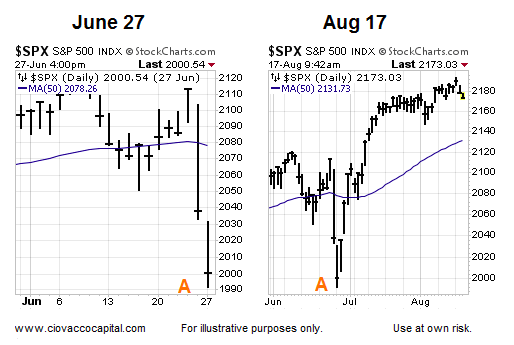
The before and after looks help us assess probabilities. The left side of the image below shows the S&P 500 and its 10-day moving average as of the close on Monday, June 27. The right side shows the same chart as of August 17. Remember, the concepts shown with the 50-day and 200-day in 2008 above apply to all moving averages and all trading and investing timeframes.
The 21-Day Exponential Moving Average
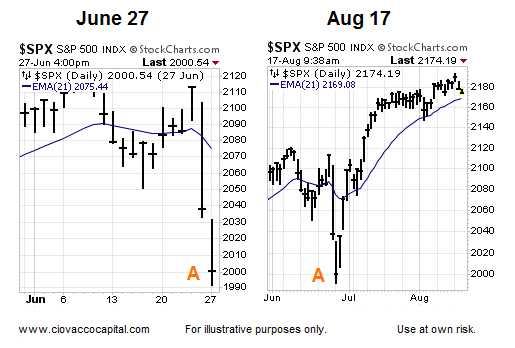
On the left side of the image below, price is below the 21-day exponential moving average and the slope of the moving average is down. Compare and contrast the left and right sides and we see observable improvement; improvement that can be measured and/or used in computer code.
The 50-Day Moving Average
Not too many bad things can happen for an extended period of time as long as the S&P 500’s 50-day has a positive slope; as it does today. Can bad things happen when the 50-day has a positive slope? Sure they can; we are are talking about odds rather than certainties. If you are looking for certainty, the markets are not for you.
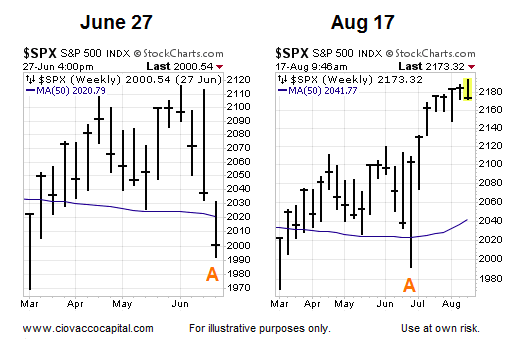
The 50-Week Moving Average
Our market model is highly diversified via inputs and timeframes. An investment that looks good on a 60-minute, daily, weekly, and monthly chart has better odds of being successful than an investment that is only attractive on a daily chart. The 50-week moving average helps us track longer-term trends. After the Brexit low was made on Monday, June 27, the 50-week moving average turned back up in a bullish manner.
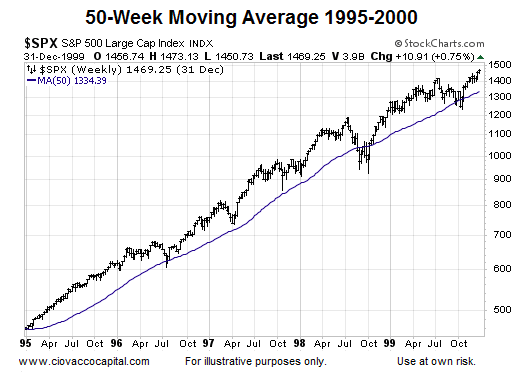
All Trends Experience Countertrend Moves
Does the technical improvement above mean stocks will be green every day, week, or month? No, all trends have normal and 100% to be expected countertrend moves. Notice in the chart below how volatile and unnerving price action can be in the context of a long-term bullish trend. Price is volatile below, but the 50-week’s slope remained bullish for almost the entire period, showing us that moving averages can help us discern between volatility to ignore and volatility to respect.
How Does 2016 Compare To 2000 and 2007?
If you are wondering how the S&P 500’s 50-day and 200-day compare to the peaks in 2000 and 2007, numerous comparison charts can be found in a recent post of ours dated August 15.
Thanks for reading.
Read more from Chris on his CCM blog.
Twitter: @CiovaccoCapital
Any opinions expressed herein are solely those of the author, and do not in any way represent the views or opinions of any other person or entity.


