“The biggest problem that most people have is that they read Wall Street research reports and they believe the Wall Street hype… Wall Street analysts are very, very easy to fool, they’re generally parrots for what management tells them.” – Sam Antar, former CFO Crazy Eddie
In 2018, Goldman Sachs underwrote 513 corporate debt issuance deals totaling $94.5 billion. They were paid an average fee of 0.48% or approximately $453.6 million for those efforts.
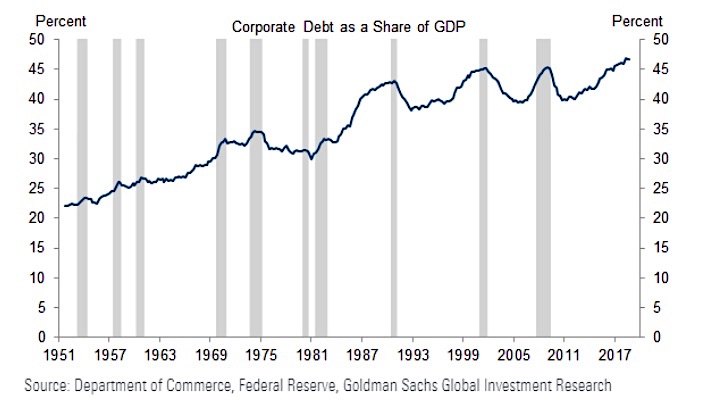
In a recent research report entitled, Corporate Debt Is Not Too High, Goldman Sachs discusses why they are not concerned with the current levels of corporate debt despite record levels of corporate debt when compared to the nation’s GDP as shown in the chart below.
Goldman’s argument cites the following four reasons:
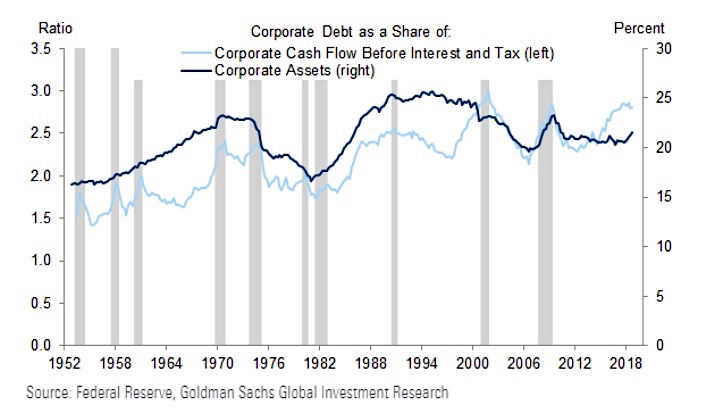
- Corporate debt remains below the 2001 peak as a share of corporate cash flows and has declined as a share of corporate assets
- Lower interest rates and more stable cash flows, which help reduce the cost of debt, mean that equilibrium leverage is likely higher than most of the post-war period
- Corporate debt in aggregate has a longer maturity which has reduced the refinancing risk
- The corporate sector runs a financial surplus which implies that capital expenditures are less dependent on external financing and less vulnerable to a profit squeeze
As discussed in our article The Corporate Maginot Line, not only have corporate debt levels risen dramatically since the financial crisis, but I believe the quality of that debt has declined markedly. With the post-crisis recovery and expansion, the full credit spectrum of corporate debt levels are significantly larger, but debt outstanding in the single-A (A) and triple-B (BBB) rating sectors have grown the most by far.
Unlike previous periods, the composition of corporate debt within the investment grade sector is now heavily skewed toward the riskiest rating category of BBB. BBB-rated securities now represent over 40% of all corporate bonds outstanding. Additionally, all sorts of other risky loans reside as liabilities on corporate balance sheets and are potentially toxic assets for banks and investors. Most notable are leveraged loans extended to businesses by banks to corporations.
Beyond the amount of debt outstanding, another consideration related to creditworthiness are the uses of cash raised by corporations via debt issuance. Have the proceeds been used productively to enhance the future earnings and cash flows of the company, thereby making it easier to service the debt, or have they been used unproductively, creating a financial burden on the company in the future?
In A Perfect World
In an environment where the economy continues to grow at 2% and interest rates remain low, corporations may be able to continue borrowing at the pace required to fund their operations and conduct share buybacks as they wish. The optics appear sound and, based on linear extrapolation of circumstances, there is no reason to believe that tomorrow will differ from yesterday. However, if things do change, this happy scenario being described by the analysts at Goldman Sachs may turn out to be naively optimistic and imprudent.
Let us consider Goldman’s four points one at a time:
1. Corporate debt remains below the 2001 peak as a share of corporate cash flows and has declined as a share of corporate assets
Corporate debt as a share of cash flow may not be at the 2001 peak, but it is higher than every other instance since at least 1952. As seen in the chart below, this measure tends to peak during recessions, which makes sense given that cash flows weaken during a recession and debt does not budge. This argument is cold comfort to anyone who is moderately aware of the late cycle dynamics we are currently experiencing.
Using corporate debt as a share of corporate assets as a measure of debt saturation suffers from a similar problem. The pattern is not as clear, but given that the value of corporate assets tends to decline in a recession, this metric does not offer much confidence in current conditions. While not at or above prior peaks, debt as a share of corporate assets appears somewhat elevated relative to levels going back to 1952. Unlike debt as a share of cash flow, this metric is not a helpful gauge in anticipating downturns in the economy.
continue reading on the NEXT PAGE…

 Rolling Over At Key Fibonacci Level?")


 Rolling Over At Key Fibonacci Level?")

