A matter of weeks ago, Gold (GLD) was left for dead, and undesirable to investors. The yellow metal was trading near the lower bounds of its range when it suddenly flipped on the rally switch into January.
Aaron Jackson called our attention to the rally prospects with his post: Is A January Gold Rally Taking Shape? The rally saw Gold prices move above $1300 for the first time in 5 months and renewed investor hopes of a rebound in 2015.
That said, a rally can only occur when dips are bought. And the current pullback that started on January 23 is still awaiting dip buying confirmation.
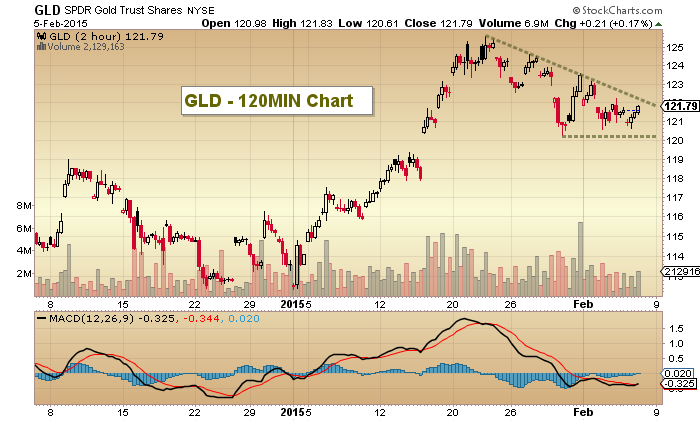
Moreover, the pullback in Gold prices has created a deep flag pattern (almost triangle-like). This hints at some indecision here. While the rally and pullback still has a bullish look, its lack of of follow through to the upside is notably bearish… especially in light of the US Dollar’s pullback off its 1/25 high.
Price is beginning to narrow and a near-term move appears to be imminent. Could Friday’s jobs report provide a catalyst for that move?
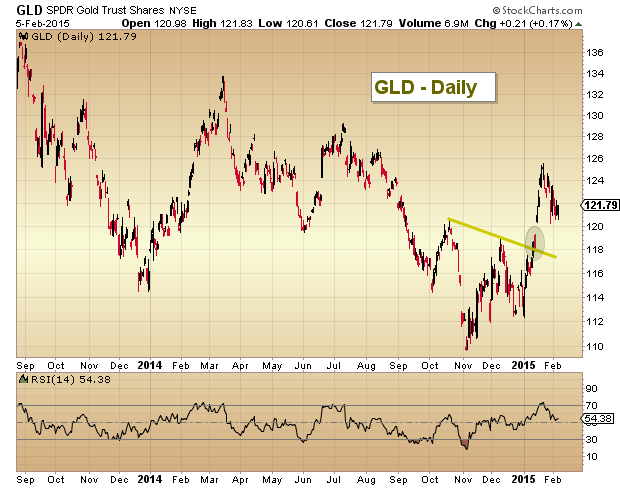
In the daily chart below, you can see the breakout above downtrend resistance that catapulted Gold to 5 month highs around $126 GLD (and just above $1300 on spot Gold). But the pullback in GLD has sent its Relative Strength Index (RSI) down near 50 on the daily chart. This is a key level to watch. Several rally attempts have seen the 50 RSI level fail on pullbacks, leading to lower prices.
Gold (GLD) Daily ETF Chart
So let’s discuss the implications of a break higher or lower out of the this setup.
Should GLD break higher, it would raise the probability of a retest of the January price highs (at a minimum). On the other hand, a break lower would likely lead to gap-fill and a retest of the breakout around the $118 level. The latter would also weaken the rally and require more patience (and discipline) from investors.
Gold (GLD) Zoom 120MIN Chart
The next move in Gold prices may have implications for the Gold Miners (GDX) as well. GDX is attempting to breakout to 5 month highs. Thanks for reading.
Follow Andy on Twitter: @andrewnyquist
No position in any of the mentioned securities at the time of publication. Any opinions expressed herein are solely those of the author, and do not in any way represent the views or opinions of any other person or entity.


 Ready To Break Out?")
 Rolling Over At Key Fibonacci Level?")
 Ready To Break Out?")

