The following chart and data highlight non-commercial commodity futures trading positions as of May 1, 2018.
This data was released with the May 4 COT Report (Commitment of Traders). Note that this chart also appeared on my blog.
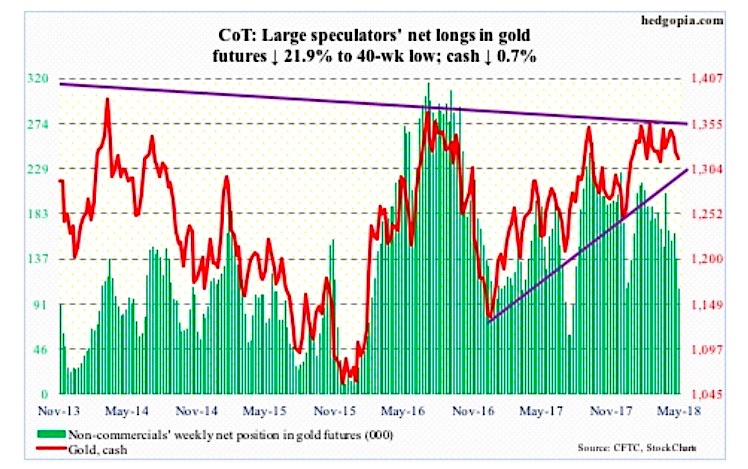
The chart below looks at non-commercial futures trading positions for Gold. For the week, the price of spot Gold fell -0.7%.
Here’s a look at Gold futures speculative positioning. Scroll further down for commentary and analysis.
Gold Futures: Currently net long 106.8k, down 29.9k.
In two weeks, the cash ($1,314.70/ounce) travelled from the daily upper Bollinger band to the lower. After getting rejected at $1,360-70 resistance on April 18, gold quickly dropped to test $1,300, which is the lower bound of a nearly two-year range.
This time around, that support approximates the 200-day as well as a rising trend line from December 2016. A loss of this exposes the metal to a test of trend-line support around $1,285 from December 2015. That was when gold bottomed at $1,045.40 after peaking in September 2011 at $1,923.70. Gold bugs cannot afford to lose this.
By the looks of things, they are not ready to give away $1,300. There is room to rally (more here), particularly if the US dollar weakens. The 50-day lies at $1,329.77.
Flows can always improve. In the week through Wednesday, GLD (SPDR gold ETF) lost $187 million, even as IAU (iShares gold trust) took in $88 million (courtesy of ETF.com).
Non-commercials are the other wildcard. They have been cutting back net longs. But even in the face of this, the cash has not lost $1,300.
Twitter: @hedgopia
Author may hold a position in mentioned securities at the time of publication. Any opinions expressed herein are solely those of the author, and do not in any way represent the views or opinions of any other person or entity.


 Ready To Break Out?")


