Stock Market Futures Considerations For November 29, 2017
The S&P 500 (INDEXSP:.INX) and Nasdaq (INDEXNASDAQ:.IXIC) are trading modestly higher on Wednesday morning as traders try to keep momentum from yesterday’s big rally going. Check out my futures trading commentary and key price levels below.
Note that you can access today’s economic calendar with a full rundown of releases.
S&P 500 Futures
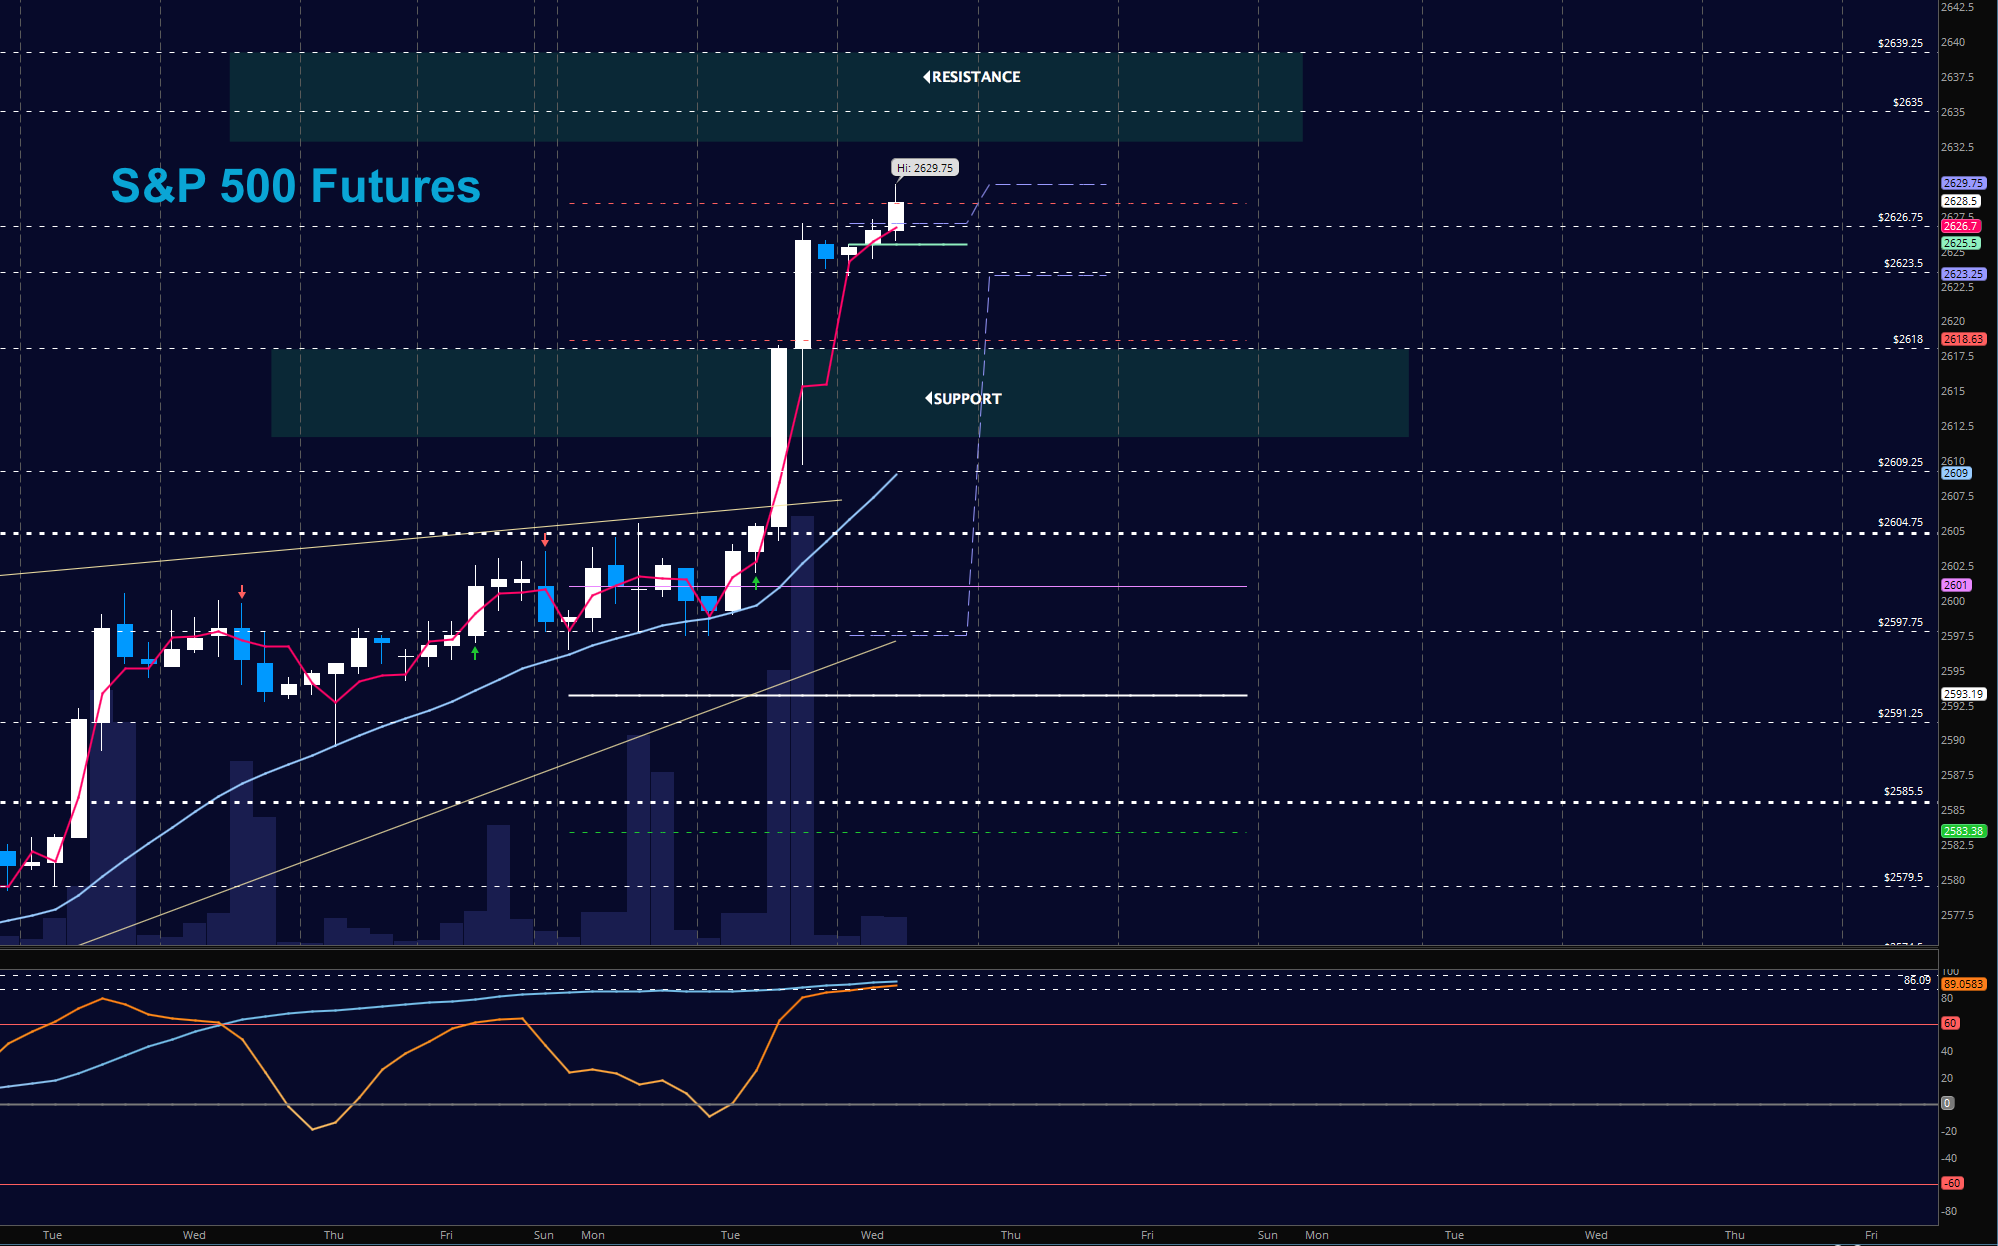
After a brief intraday dip testing support, charts resumed the march forward. As before, any breakdowns should bring value buyers to the table. As long as new support holds near 2622, we should have bullish action continue intraday. Below 2609, intraday strength could shift into bearish formations, but not before buyers fail to hold the likely bounce. The bullets below represent the likely shift of trading momentum at the positive or failed retests at the levels noted.
- Buying pressure intraday will likely strengthen above a positive retest of 2627.75
- Selling pressure intraday will likely strengthen with a failed retest of 2622.5
- Resistance sits near 2622.5 to 2629.5, with 2635.5 and 2639.25 above that.
- Support holds between 2625.5 and 2622.5, with 2609.5 and 2597.5 below that.
NASDAQ Futures
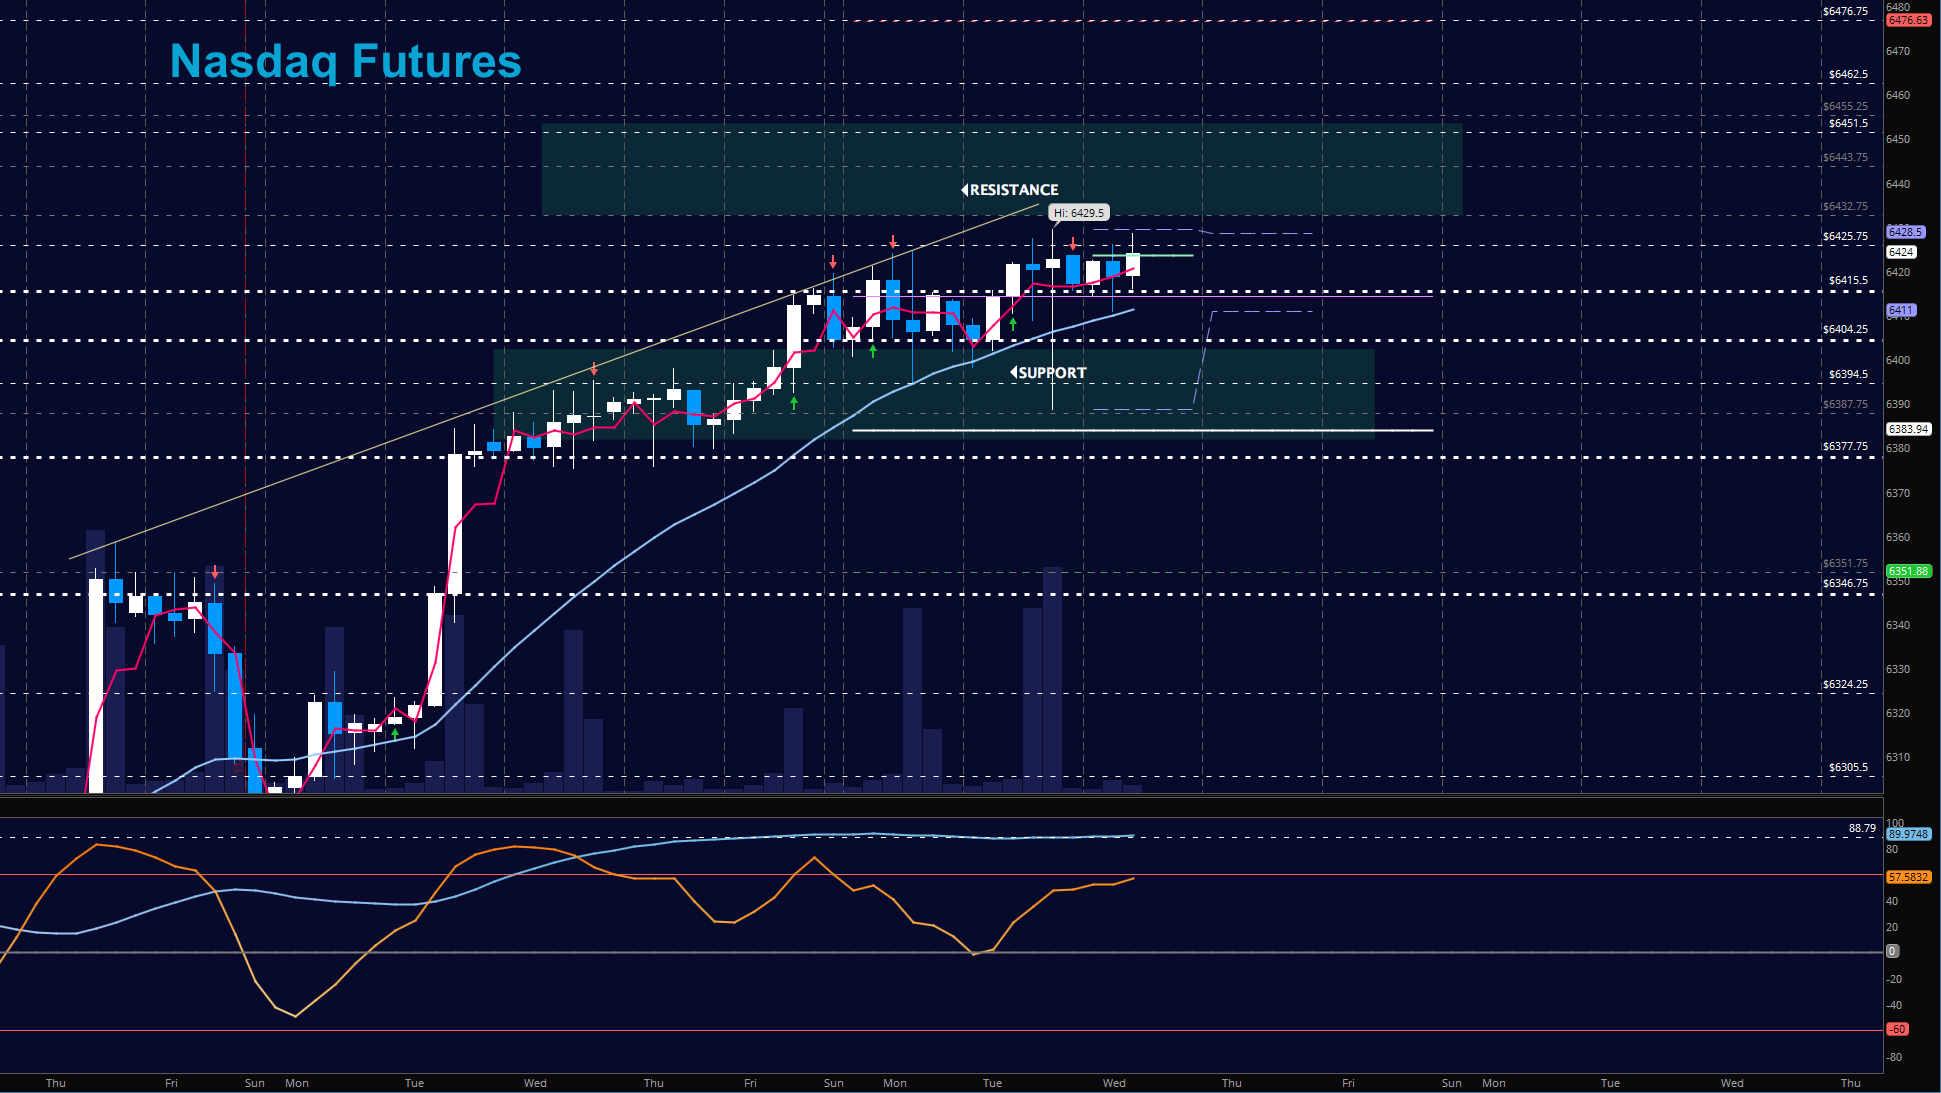
Unlike the ES_F, the NQ_F has yet to break higher. Bullish undercurrents remain strong but the environment still suggests waiting on higher support tests rather than following breakout motion. As we move higher, we need to watch support edges as charts feel very extended. The environment remains the same -performers will be bought so engage in your favorites stocks within the index at bounces off support to assume the least risk, particularly in this index, as more wicks occur. The bullets below represent the likely shift of intraday trading momentum at the positive or failed tests at the levels noted.
- Buying pressure intraday will likely strengthen with a positive retest of 6429.5
- Selling pressure intraday will likely strengthen with a failed retest of 6410.5
- Resistance sits near 6424.75 to 6432.5 with 6443.5 and 6451.5 above that.
- Support holds near 6415.5 and 6404.75, with 6394.75 and 6383.75 below that.
WTI Crude Oil
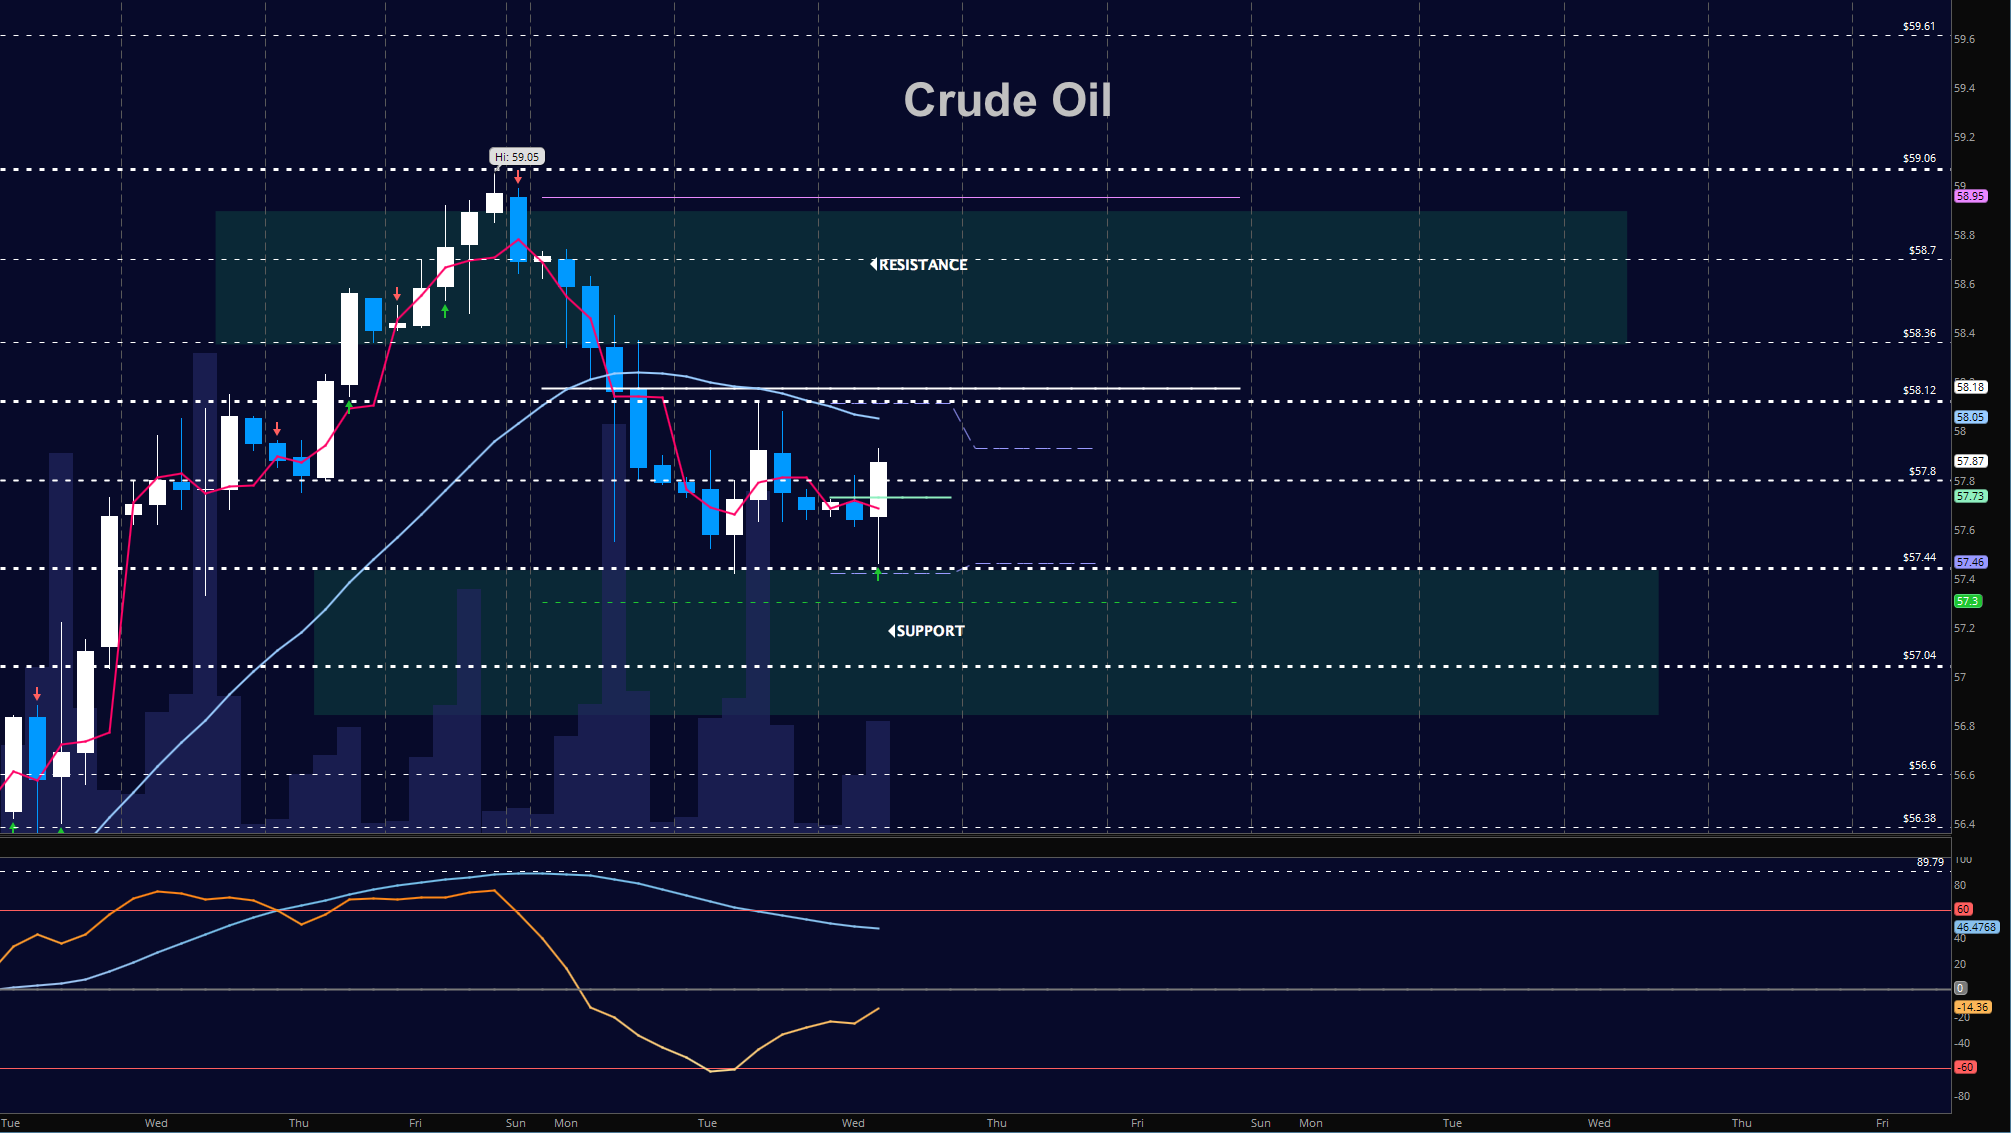
Short cycle double bottoming formation showing near 57.44 today as oil bounced off this level in the early morning and finally lifting above 57.86 where buyers should try to hold more control. The EIA report is today. Resistance is now at 58.36 as momentum is mixed. Support holds near 57.4. The bullets below represent the likely shift of trading momentum at the positive or failed tests at the levels noted.
- Buying pressure intraday will likely strengthen with a positive retest of 57.92
- Selling pressure intraday will strengthen with a failed retest of 57.32
- Resistance sits near 57.86 to 58.18, with 58.36 and 58.7 above that.
- Support holds near 57.32 to 57.13, with 57.04 and 56.74 below that.
Twitter: @AnneMarieTrades
The author trades stock market futures every day and may have a position in mentioned securities at the time of publication. Any opinions expressed herein are solely those of the author, and do not in any way represent the views or opinions of any other person or entity.


")


 Rolling Over At Key Fibonacci Level?")
