 I’ve been talking about the CBOE Options Equity Put/Call Ratio (CPCE) since late June. In fact, I wrote a post about the equity put call chart being one that scares me over at Yahoo Finance last week. And I continue to think it’s a big near-term concern.
First off, to keep this simple, when this ratio trends lower – it has tended to be bullish for the S&P 500 (SPX) and when it trends higher we tend to see market weakness. Think of it like this, when everyone is bearish and the put/call ratio is high, this is potential buying pressure once those bearish bets are exhausted and unwound. Once this happens, the ratio can move lower and with it we have a higher SPX. The flipside is once it gets extremely low (like was saw in late June), everyone is a little too bullish and the opposite happens.
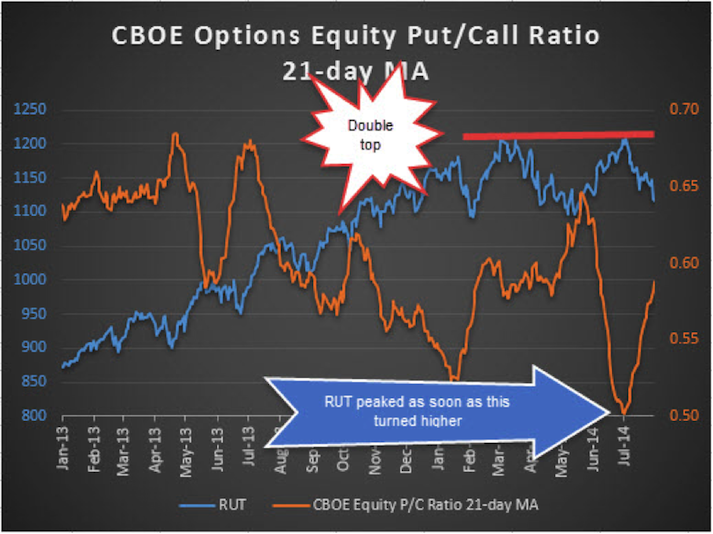
Well, back in late June we saw a super low equity put call ratio and that was a warning of too much complacency. Then once it flipped and started to go higher, that once again led to market weakness. Check out the chart below with the Russell 2000. Nearly to the day this ratio started to trend higher it resulted in big time weakness in the small caps. Throw in the fact last week the S&P 500 had its worst week in years and this ratio again has accurately called the weakness.
My pal David Templeton over at HORAN Capital Advisors here in Cincinnati writes a must read blog and he pointed out that on Friday the very ratio I’ve been talking about for weeks just had a spike over 1.0 – which is extremely rare and could suggest extreme fear just came into the market. Check out the chart below.
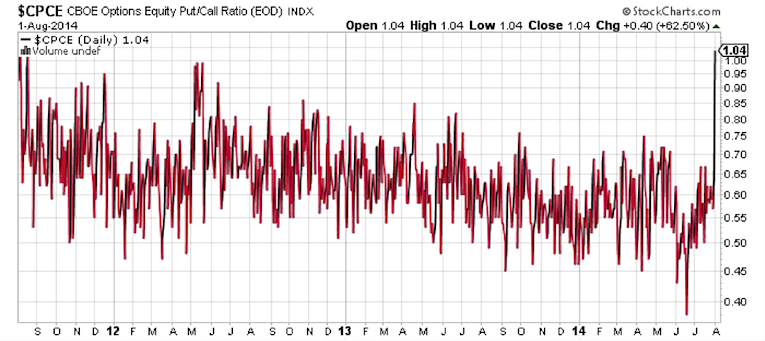
Friday was the largest one day spike for the equity put call ratio since August 2011. What you need to remember is back then the market was down about 20% in a little over a week, so panic was in the air. This time around we are still just a few percent away from a new all-time high. Also Thursday was the big bloodbath, yet all the put buying took place on Friday a day late.
Getting to it, Friday’s ratio of 1.04 was the 19th highest day going back to 2003. Also, it was the 31st time this ratio checked in over 1.0. Below are all the times it happened and subsequent S&P 500 daily return. I did it this way because Friday’s sell-off was just -0.29%, which seemed rather muted for so much panic in the options market.
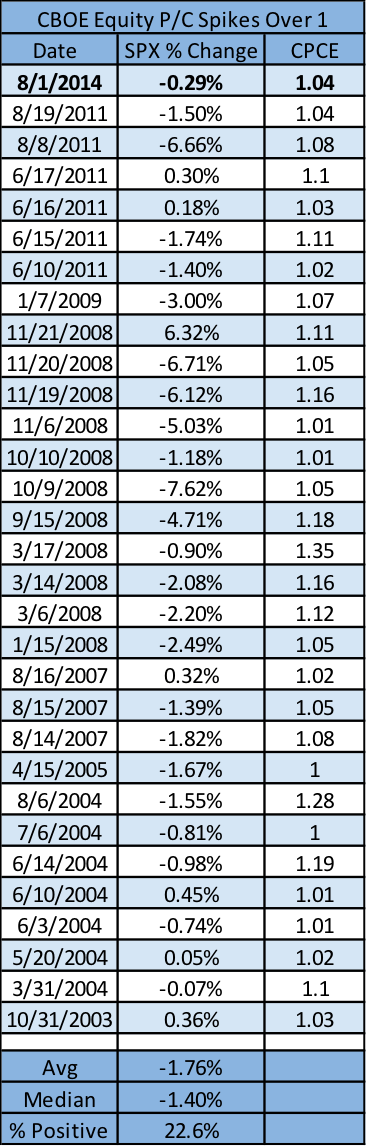
As you can see, the average SPX move when the equity put call ratio is >1.0 is -1.76% and higher just 23% of the time. Friday indeed was a rare day as things held together, but I think it was just a late reaction to panicking after Thursday’s huge drop.
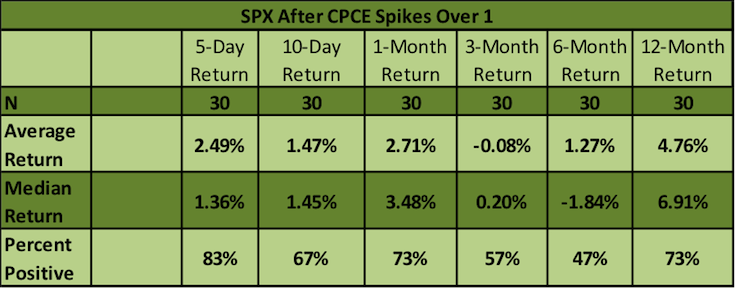
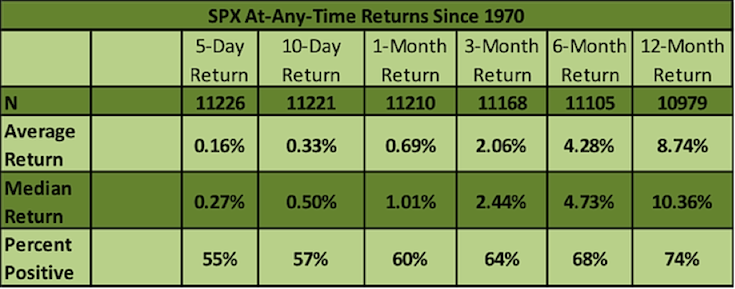
Here’s when things get interesting. Taking a look at the previous 30 times the equity put call ratio was >1.0, we find the SPX a week later is up nearly +2.5% on average and higher 83% of the time. In fact, going out up to a month you’ll see we tend to see better-than-average returns on the S&P 500, but from 3- to 12-months out there is substantial underperformance.
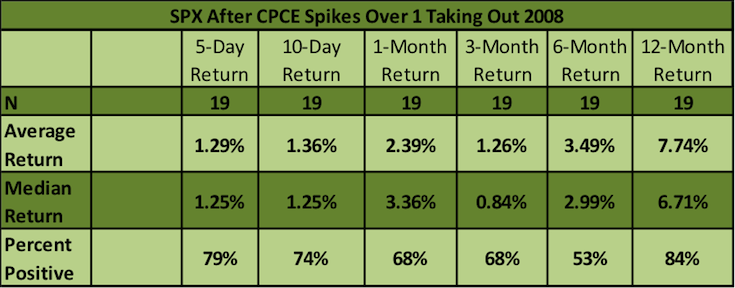
Looking at the results, 11 of the returns took place in 2008. Now I’m not a guy who just likes to throw out data, but if you do take out those 11 returns from 2008 the returns get a little bit better longer-term, but still underperform versus the average returns.
Here are all the instances and returns afterwards going back to 2003.
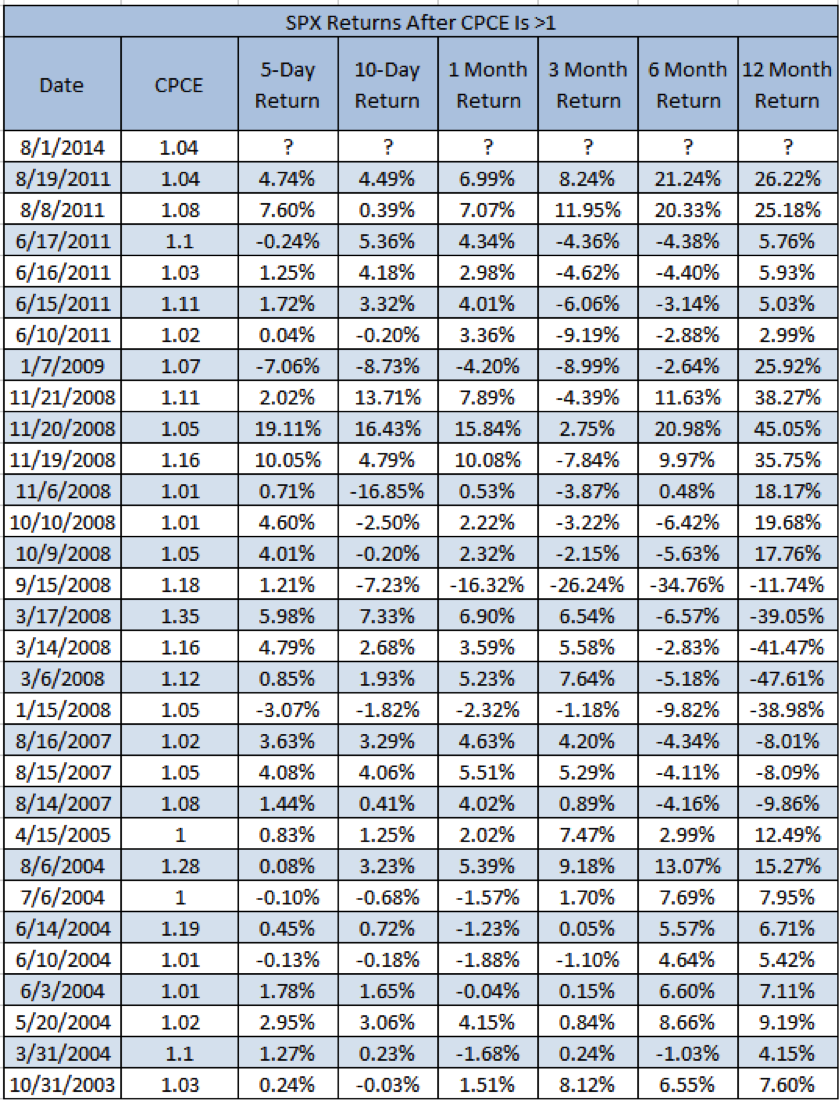
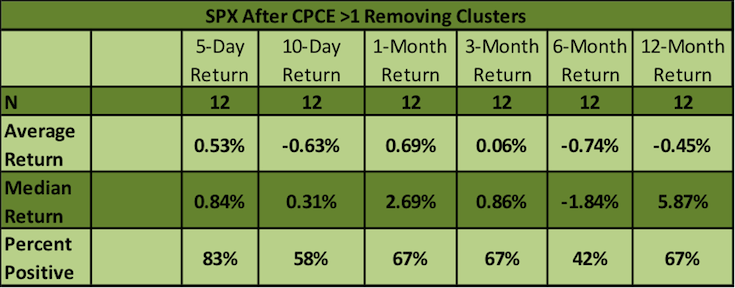
Lastly, it is pretty clear most of these happen in clusters. Check out 2004, 2008, and 2011 for instance. So this time I only counted the first signal in a cluster and it had to be a full month without another signal to count the next signal. Again, the point here is to remove clusters and maybe get a ‘truer’ result. Well, this time the results are extremely bearish going out up to a year. Flat 3 months later and down 6 and 12 months later won’t get anyone excited.
I wish I had some big life-time changing conclusion to all of this, but I don’t. Near-term it does seem as though many have panicked in a very short amount of time, which has been consistent going back the past few years during this rally. Yet, the fact is this signal isn’t nearly as bullish as you might think and it doesn’t do much to support being super bullish going out longer-term.
Follow Ryan on Twitter: @RyanDetrick
No position in any of the mentioned securities at the time of publication. Any opinions expressed herein are solely those of the author, and do not in any way represent the views or opinions of any other person or entity.
 Rolling Over At Key Fibonacci Level?")


