It’s been a rough year thus far for investors. And there really haven’t been a lot of areas to hide.
Equities and bonds have been hit hard. Oddly enough, the US Dollar and commodities have fared well (at the same time).
As mentioned, not many equities have been spared. This includes emerging markets. Obviously, Russia (war) and China (economic slowdown) haven’t helped… but this turn lower started over a year ago.
Today, we look at the long-term chart and highlight a critical impasse.
Note that the following MarketSmith charts are built with Investors Business Daily’s product suite.
I am an Investors Business Daily (IBD) partner and promote the use of their products. The entire platform offers a good mix of analysts, education, and technical and fundamental data.
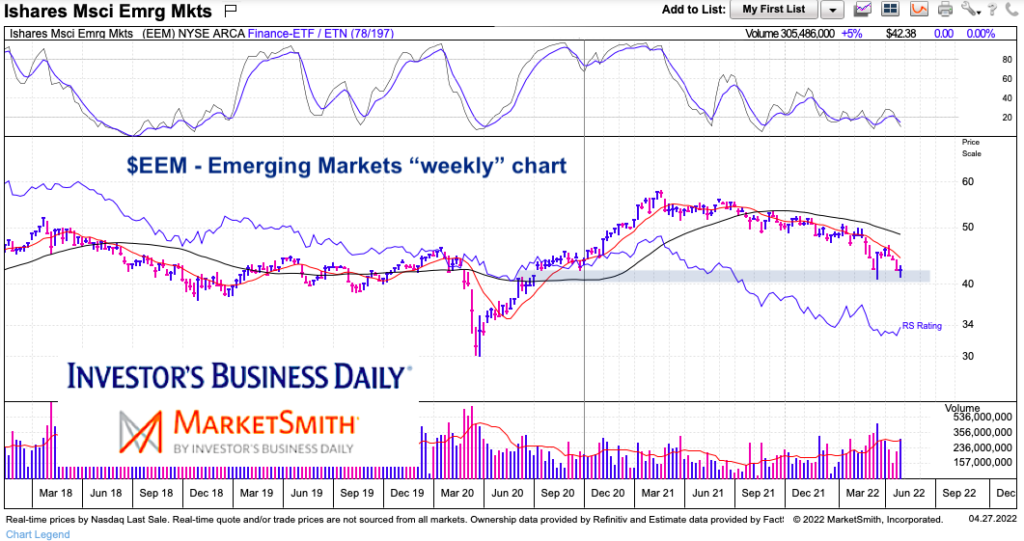
$EEM Emerging Markets ETF “weekly” Trading Chart
As you can see, the Emerging Markets ETF (EEM) has been in a year+ decline. Both the 10-week and 40-week moving averages are downward sloping.
But, more important, the price action has arrived at a critical juncture. As you can see, we have traded into the bullish breakaway gap higher from 2020. Will this area (+/- a few dollars provide support). The $40 area also marks the 61.8 Fibonacci retracement of the 2020 low to 2021 high.
Twitter: @andrewnyquist
The author may have a position in mentioned securities at the time of publication. Any opinions expressed herein are solely those of the author, and do not in any way represent the views or opinions of any other person or entity.


 Ready To Break Out?")
