The stock market rally has morphed into a back and fill consolidation here in March.
The consolidation period has been marked by weakness in small cap stocks – see last week’s article on the “beta warning” with the Russell 2000 Index.
Today we look at the broader, if global, index: The Dow Jones Industrial Average.
And more specifically, it’s moving averages “golden cross” (when a shorter-term moving average crosses up through a longer-term moving average). Though this is a bullish intermediate term event, investors need to stay focused, disciplined, and patient. We’ll look at 2015 / 2016 as examples.
Note that the following MarketSmith charts are built with Investors Business Daily’s product suite.
I am an Investors Business Daily (IBD) partner and promote the use of their products. The entire platform offers a good mix of technical and fundamental data and education.
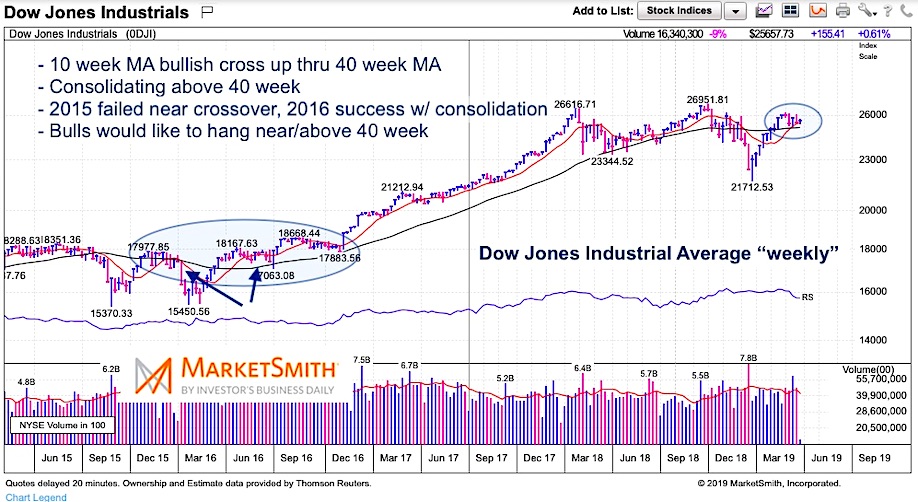
Dow Jones Industrial Average “weekly” Chart
The weekly chart highlights the strong multi-week rally, followed by our recent consolidation. The 40 week moving average (MA) is flat, while the 10 week MA is crossing up through it.
In 2015, the rally failed just as the 10 week touched up near the 40 week. Notice, though, that the 40 week was still angling slightly lower. In 2016, the rally (and crossover) succeeded but not before several weeks of backing and filling. Notice that the 40 week was flat and turning slightly higher (similar to 2019).
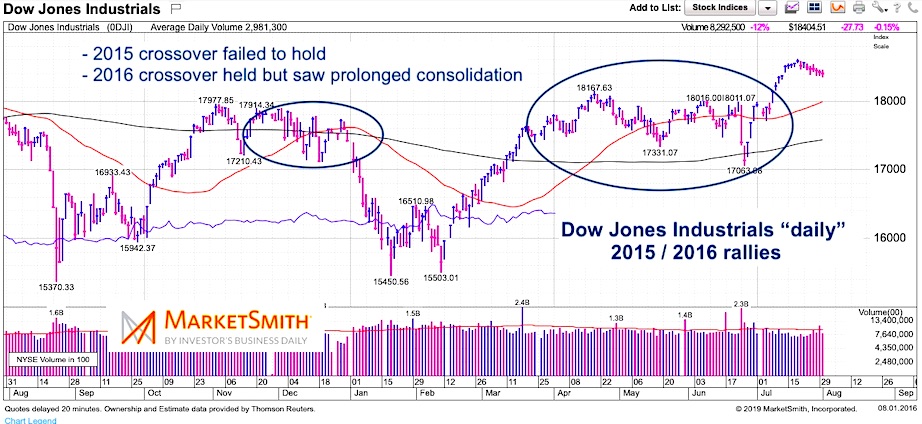
Dow Jones Industrial Average “daily” Chart (2015/2016)
Here we zoom in on 2015 / 2016 with daily moving averages.
As you can see, in 2015 the 50 day MA did briefly cross up through the 200 day MA before the failing to hold another strong selloff commenced. Notice the 200 day was sloping lower. In 2016, the rally held but only after prolonged consolidation. As in the weekly chart, we once again see a crossover through a flat to sloping higher 200 day MA.
2016 is a better example. In that case, we ended up with prolonged consolidation / backing and filling. Patience here.
Twitter: @andrewnyquist
The author has a position in mentioned securities at the time of publication. Any opinions expressed herein are solely those of the author, and do not in any way represent the views or opinions of any other person or entity.

: Showing Some Signs of Emerging Strength")

