Fluctuating oil prices is nothing new. We’re no longer surprised to see crude move +/- 4% in a day depending on the news, whether it be a production accident, an OPEC meeting or rising case counts.
Most recently, oil has been under pressure on rising concerns over the demand impact of the next wave of infections. The contagious delta variant is already triggering renewed lockdowns in parts of China and other Asian countries where vaccination rates are low. This is a global concern, but we continue to believe that this remains a passing demand headwind, which can be offset by existing supply tailwinds.
Despite the recent pullback in share prices, it’s still been a great year for energy exposure. Year-to-date the TSX Energy sector has returned 43.7%, and U.S producers have risen 43% compared to 19.7% and 17.5% for the TSX and SPX, respectively. Impressive, considering many big names have pulled back around 20%.
WTI prices backed up from a high of $77 on July 6 to a low of $65 on August 9. From last week’s low, prices have firmed but are still trading below $70/bbl. (Chart 1)
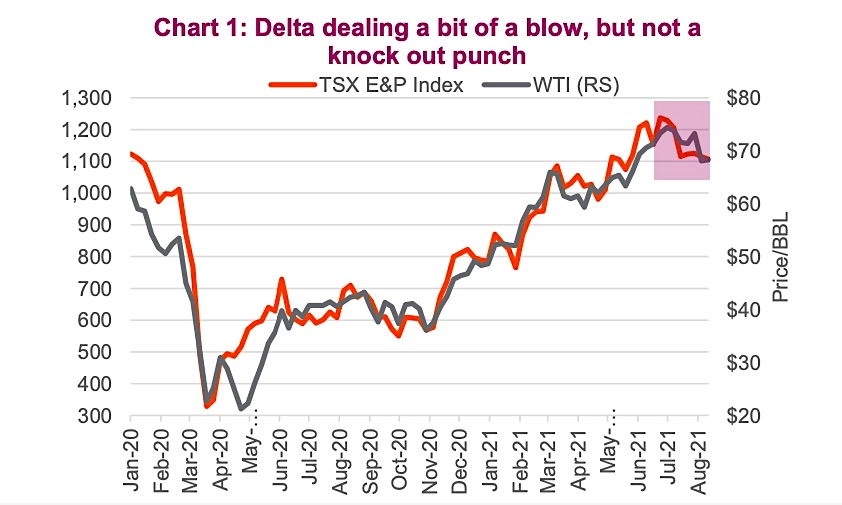
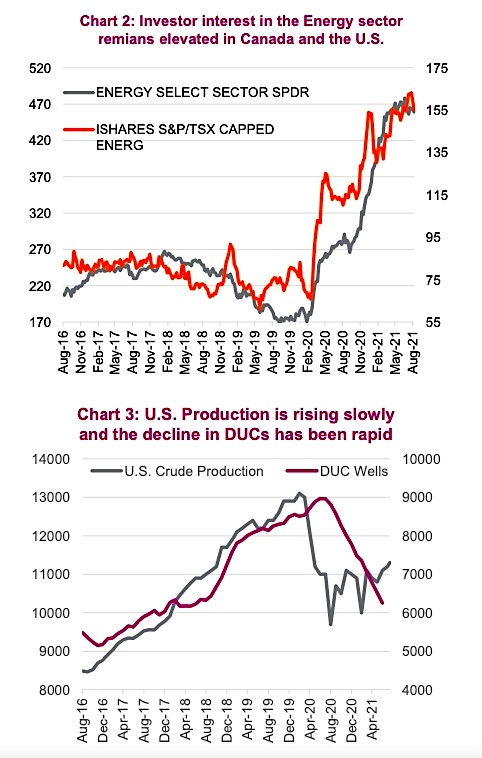
The 15% correction actually appears rather small when you consider oil prices rallied 128% from the beginning of November to their highs. Oil companies have fared better than spot prices during the latest drawdown this past week, perhaps a sign that investors remain constructive on the producers, despite the swings in the spot market. Investor interest gauged by ETF shares outstanding remains near record highs. (Chart 2)
The IEA noted last week that growth in demand for crude oil ground to a halt in July, and has revised its future demand outlook lower because of surging infections from the delta variant. OPEC sees things a little differently and has left its demand outlook as is for now. We should note that the IEA’s sharp cut in its demand forecast remains an outlier, but its view carries some weight.
Demand won’t be back to ‘normal’ for some time, but we continue to see improvements from travel, although traffic congestion metrics have leveled out below 2019 levels. Workplace mobility remains at -42% compared to baseline in Canada and -33% in the United States, based on Google mobility data.
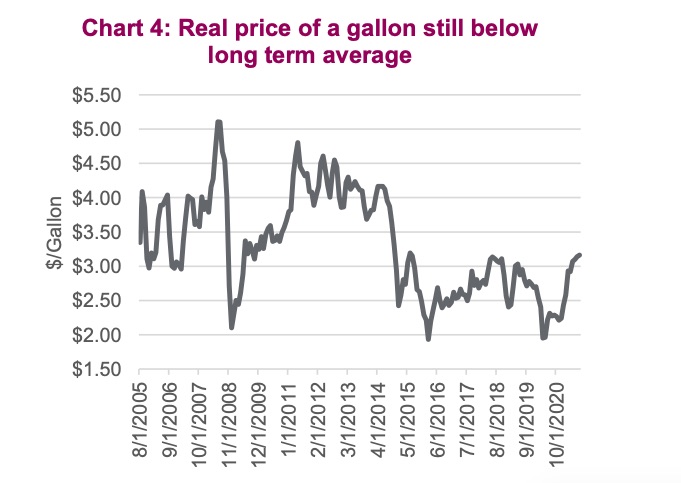
The latest supply data points reassure us that the next driver of oil prices will shift from demand to supply for several reasons. First, the OPEC+ ramp-up in production has so far fallen short of their new quota. Second, there are few signs of a material return of Iran exports any time soon. Third, the latest earnings season confirmed that the discipline of producers continued. Fourth, rig counts have been slow to rise and the drilled but uncompleted wells (DUCs) in the U.S. have declined precipitously (Chart 3), yet production has been slow to recover. So far, all appear to be showing a tighter energy market over the course of the year than expected. Supply is no longer an economic question; it is heavily political as OPEC+ could change its tune at any time. But for now, we take their current position that they would prefer higher prices at face value.
When oil is in the news, politics are never far behind. On Wednesday of last week, the White House urged OPEC to boost production to combat climbing gasoline prices. Funny how fossil fuels are public enemy number one until the price of gas gets too expensive. Meanwhile, projects that would ship crude into the U.S. like Keystone XL are rejected. But now the President wants OPEC+ to do more to support the recovery and control inflation pressure. In terms of gasoline prices, the average U.S. price per gallon is up to $3.16 a gallon, the highest level since 2014 but when adjusted for inflation (Chart 4) you can see that prices would have to rise by nearly 30% to get to the average from 2011 to 2014.
Besides some unexpected operational missteps for some producers, it’s been a great quarter for company earnings; 89% of energy company’s beat sales expectations in Canada and 72% in the United States. Several E&Ps surprised with accelerate and/or larger than expected commitments to return excess cash to shareholders. Those that did boost their dividends or announce specials or buybacks, were relative outperfomers. Expect more of the same in terms of capital allocation if that’s what appeases shareholders. CAPX is trending near, to modestly below, budgets for many and no E&Ps in the U.S. raised their expected 2021 CAPEX budgets. FCF generation remains the common mantra along with balance sheet repair. The downside is that growth is no longer as desirable, which only spells more trouble for production levels in the future.
Investment implications
Structural challenges, namely a shift away from fossil fuels and ESG pressure persists, but we believe there is further potential in the energy complex rebound. Our base case is that over the next year we’ll continue to see a global cyclical rebound. Regardless of the forthcoming wave, the pace of economic growth is bound to slow from such high levels. One caveat is that the path to recovery will likely be bumpy which is why we prefer names that have some earnings stability such is integrated oil companies. However, should prices pull back even further we would begin to look at other pure E&P names. While the oil market is focused on the current demand headwinds, the pullback in energy prices presents an opportunity to add/build positions in a sector that we believe has further room to run over the course of what will be a drawn-out recovery.
Source: Charts are sourced to Bloomberg L.P. and Richardson Wealth unless otherwise noted.
Twitter: @ConnectedWealth
Any opinions expressed herein are solely those of the authors, and do not in any way represent the views or opinions of any other person or entity.

 Rolling Over At Key Fibonacci Level?")


 Rolling Over At Key Fibonacci Level?")
