There have been several analysts that have pointed out the decline in crude oil as being a bearish headwind for stocks.
In fact, both Chris Kimble and Mark Newton (See It Market contributors) pointed out that oil prices and the S&P 500 (NYSEARCA: SPY) peaked together, before bottoming together last year… and they may have peaked together again this year!
The Energy Sector (NYSEARCA: XLE) has been particularly weak, perhaps a precursor that Crude Oil and the US Oil ETF (NYSEARCA: USO) were going to roll over.
So what’s the big deal? Although this is just one indicator, falling crude oil prices tend to point to a slowing economy. It’s especially interesting considering that we are heading into driving season (summer). Stock market bulls would love to join forces and see crude oil prices begin to rise here. See charts and further analysis below.
Note that the following MarketSmith charts are built with Investors Business Daily’s product suite.
I am an Investors Business Daily (IBD) partner and promote the use of their products. The entire platform offers a good mix of technical and fundamental data and education.
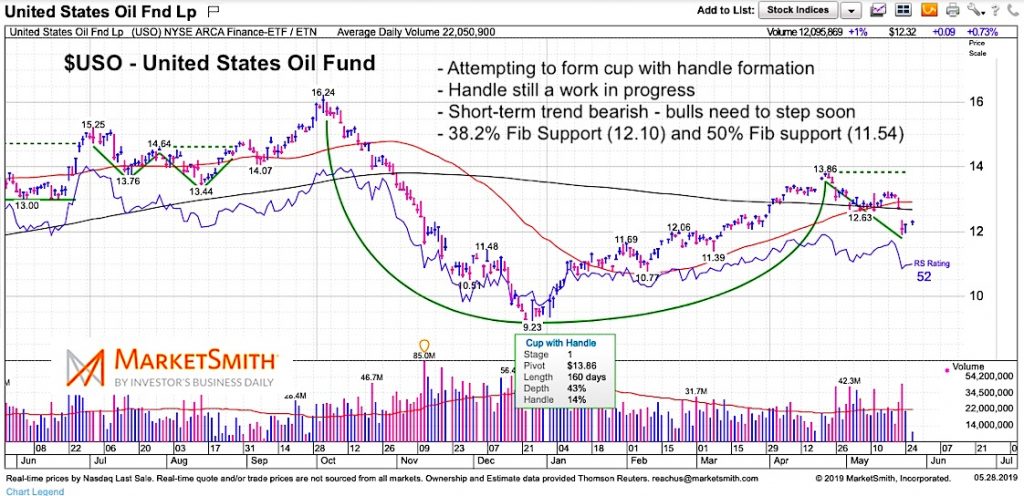
$USO – United States Oil Fund Chart
Crude oil peaks with stocks last fall, bottoms with stocks at Christmas, then peaks again this spring. Bulls hoping that they can get a bullish handle on the “cup” formation. Would be ideal for $12 to hold on $USO.
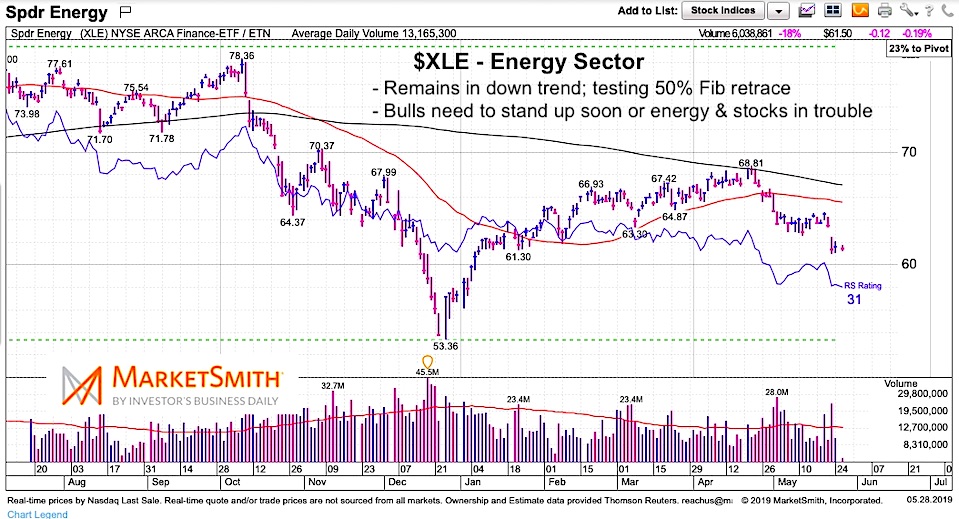
$XLE – SPDR Energy Sector Chart
The SPDR Energy Sector (NYSEARCA: XLE) has dipped a bit further than crude oil. $XLE is currently testing its 50 percent Fibonacci support. It’s also trading well below its 50/200 day moving averages. Not a good look.
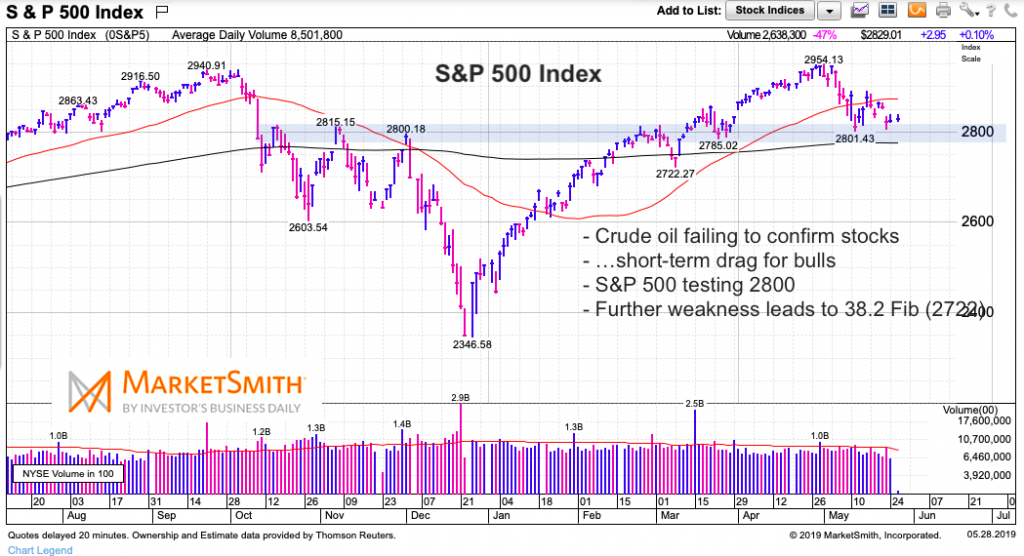
S&P 500 Chart
The US Equity market made new all-time highs this spring while Crude oil made a lower high (divergence). The subsequent decline in crude oil has pressured the broader market. It comes at a time when tensions in the Middle East are rising along with prospects of a US-China trade war.
Further weakness in on the S&P 500 will likely lead to a test of 2722 (the 38.2 Fibonacci support).
Twitter: @andrewnyquist
The author has a position in mentioned securities at the time of publication. Any opinions expressed herein are solely those of the author, and do not in any way represent the views or opinions of any other person or entity.


 Ready To Break Out?")


")
 Rolling Over At Key Fibonacci Level?")