The following is a recap of the recent Commitment of Traders Report (COT) released by the CFTC (Commodity Futures Trading Commission) looking at Commitment of Traders data and futures positions of non-commercial holdings as of April 11.
Note that the change in COT report data is week-over-week. Excerpts of this blog post also appear on Paban’s blog.
3 Commitment of Traders Report Charts Looking At Spec Futures Positions in Gold, Crude Oil, the US Dollar.
GOLD: Currently net long 172.7k, up 17.2k.
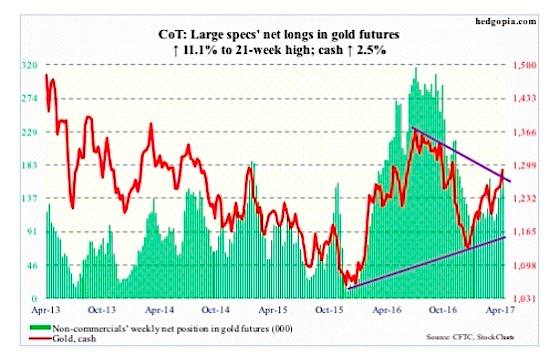
The risk-off sentiment unleashed by Syria airstrikes did wonders to gold. The cash rallied 2.5 percent for the week. After several failed attempts since February 27, the 200-day moving average has been recaptured.
In the week ended Wednesday, the SPDR Gold ETF (NYSEARCA:GLD), gained $239 million (courtesy of ETF.com). This followed inflows of $130 million in the prior week.
The metal also broke the declining trend line from last July when the cash peaked at $1,377.5, before dropping all the way to $1,124.3 by December. This is potentially an important development. Near-term, though, gold bugs likely will be forced to defend the 200-day, and after that possibly the rising 50-day.
Both Wednesday and Thursday produced candles showing fatigue.
CRUDE OIL: Currently net long 457k, up 36k.
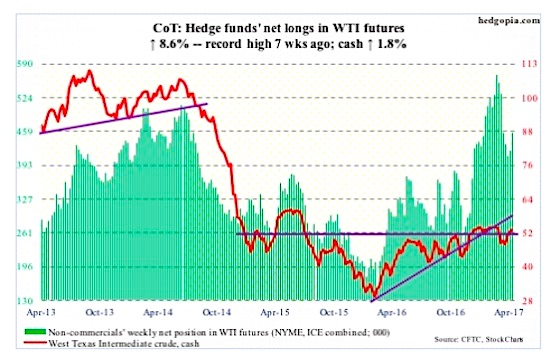
For a change, U.S. crude oil stocks fell in the week ended April 7 – down 2.2 million barrels to 533.4 million barrels. The prior week was a record. Year-to-date (over 14 weeks), last week’s drop was only the second week-over-week drop. Inventory has been relentlessly rising.
On the other hand, gasoline and distillate stocks continued to drop – down three million barrels and 2.2 million barrels to 236.1 million barrels and 150.2 million barrels, respectively. Over the last eight weeks, gasoline inventory is down 22.9 million barrels, and distillates over the last nine down 20.5 million barrels.
Refinery utilization inched up two-tenths of a point to 91 percent – a 13-week high.
Crude oil imports rose 28,000 barrels per day to 7.9 million b/d. Production continued higher – up 36,000 b/d to 9.2 mb/d.
Since OPEC reached a cutback agreement late November last year, U.S. oil production has gone up by north of 500,000 b/d!
On Wednesday, the day the EIA report came out, spot West Texas Intermediate crude oil fell 0.5 percent. This followed a 14-percent, 13-session rally from intraday low to high.
Crude oil has recaptured both 50- and 200-day moving averages as well as $51-$52. Daily conditions are way overbought. The key question is, would the bulls be able to save that support in the days ahead? The 50-day – now flattish – rests at $51.54.
US DOLLAR INDEX: Currently net long 44.3k, up 1.4k.
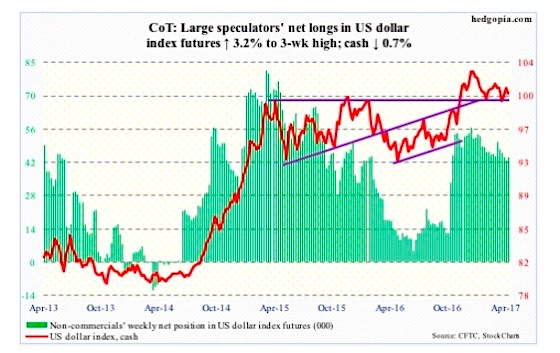
President Trump on Wednesday said that the dollar was getting too strong and that it would eventually hurt the U.S. economy. He has made similar remarks in the past.
Wednesday, the dollar index (cash) inched higher 0.09 percent, reversing intraday losses. Markets are not sure what to make of the Trump administration’s jawboning. Mr. Trump also said he would like to see interest rates stay low. That is a shot across the bows of Janet Yellen, Fed chief, to not to get too restrictive.
For now, the cash (100.46) continues to trade between 50- and 200-day moving averages. It is essentially sideways the past couple of years. Monday, it got rejected at the declining trend line from January 3. There is decent support at 99 and change.
Thanks for reading.
Twitter: @hedgopia
Author may hold a position in mentioned securities at the time of publication. Any opinions expressed herein are solely those of the author, and do not in any way represent the views or opinions of any other person or entity.
 Rolling Over At Key Fibonacci Level?")


