March corn futures closed down 1 1/4-cents per bushel week-on-week, finishing at $3.66 1/4.
Let’s review the latest corn news, USDA data, and analysis for the week ahead (February 26).
Weekly Highlights and Takeaways:
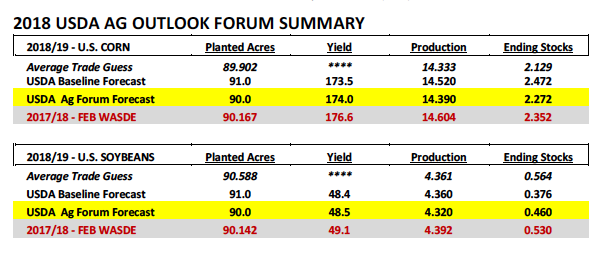
On Thursday and Friday the USDA held its annual Agricultural Outlook Forum in Arlington, Virginia, which offered insights into the USDA’s expectations for planted acreage, total production, and ending stocks for U.S. corn and soybeans in 2018/19. A summary of their findings, as well as, the potential price implications are as follows:
1. USDA Chief Economist Robert Johansson issued the agency’s planted acreage projections for 2018 estimating U.S. corn acreage at 90.0 million acres (see table below).
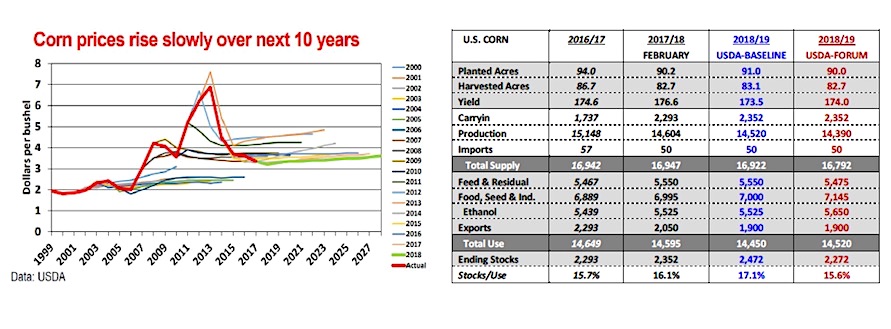
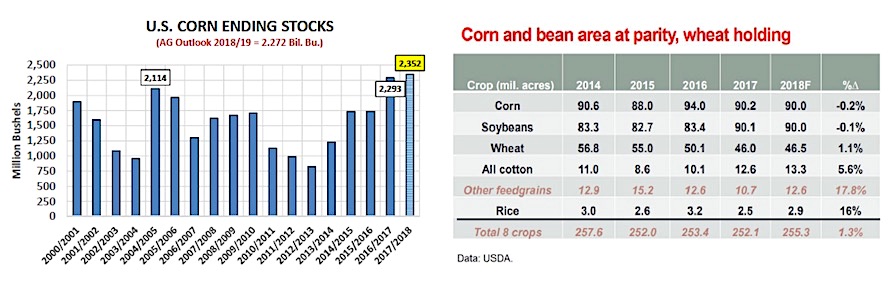
This compares to 2017/18 U.S. corn planted acreage of 90.167 million acres. Corn Bulls were hoping to see an acreage number below 90 million; especially with the new-crop soybean/corn price ratio continuing to strongly favor planting soybeans versus corn (currently trading at 2.59). Total U.S. corn production was then forecasted at 14.390 billion bushels versus 14.604 billion in 2017/18 via a U.S. corn yield of 174.0 bpa. 2018/19 U.S. corn ending stocks penciled back at 2.272 billion bushes; down just 80 million bushels from the current 30-year high of 2.352 billion in 2017/18.
2. Was there anything “Bullish” in the USDA’s 2018/19 U.S. corn supply and demand table? The short answer is…very little.
From a demand perspective the USDA did forecast 2018/19 U.S. corn demand for ethanol at 5.650 billion bushels, up 125 million bushels from 2017/18’s record high of 5.525 billion bushels. That said that increase was immediately offset by the USDA reducing U.S. corn exports to 1.900 billion bushels while also lowering “feed and residual use” 75 million bushels versus 2017/18. In my opinion the USDA’s figures once again reinforced that outside of a tangible downward adjustment in U.S. corn planted acreage (which they currently don’t foresee) and/or a below-trend U.S. corn yield (dependent on summer weather), new-crop corn futures (CZ18) aren’t likely to gravitate beyond the range of highs we’ve seen the last two years.
In 2017, the calendar year day high in December 2017 corn futures was $4.17 ¼ on July 11th, 2017. In 2016, the calendar year day high in December 2016 corn futures was $4.49 on June 17th, 2016. On Tuesday of this week (2/20), December 2017 corn futures traded up to its current calendar year day high of $3.99; just 18 ¼-cents removed from last year’s CZ17 calendar year day high. Considering the Ag Outlook Forum offered a U.S. corn ending stocks projection for 2018/19 nearly equal to 2017/18, I would have to believe December 2018 corn futures ability to trade much higher than $4.00 is extremely limited at this time. Ultimately it’s likely going to take a U.S. corn supply-side correction this spring or summer to create rallies substantially beyond $4.20 to $4.50…
3. SOYBEANS —- USDA Chief Economist Robert Johansson offered a 2018/19 U.S. soybean planted acreage forecast of 90.0 million acres, down just 142,000 acres from 2017/18.
That type of planted acreage figure (2nd highest ever) combined with 2018/19 U.S. soybean carryin stocks of 530 million bushels (current estimate as of February 2018 WASDE report) should provide the U.S. soybean balance sheet a significant supply cushion going into the 2018 growing season. Total U.S. soybean production was forecasted at 4.320 billion bushels versus 4.392 billion in 2017/18 via a U.S. soybean yield of 48.5 bpa. 2018/19 U.S. soybeans ending stocks were estimated at 460 million bushels; down only 70 million bushels from 2017/18 (current U.S. soybean ending stocks summary on page 3). Overall…based on the USDA’s figures, I’m struggling to find a reason for November 2018 soybean futures to move substantially higher at this time with SX18 trading at approximately $10.30 per bushel. In 2017, the calendar year day high in November 2017 soybean futures was $10.47 on July 11th, 2017. This compares to the current calendar year day in November 2018 soybean futures of $10.31 ¼, which was established on Friday of this week (2/23).
TO SUMMARIZE… I think it’s safe to say the USDA’s Agricultural Outlook Forum largely provided traders with S&D tables and rhetoric they already anticipated. The next major report from the USDA will be its March 31st Planting Intentions summary. I continue to believe that given current new-crop soybean/corn economics U.S. corn planted acreage will fall BELOW 90 million acres. I find myself more in the camp of Informa Economics looking for an acreage figure closer to 89 to 89.2 million acres.
MARCH 2018 CORN FUTURES PRICE FORECAST
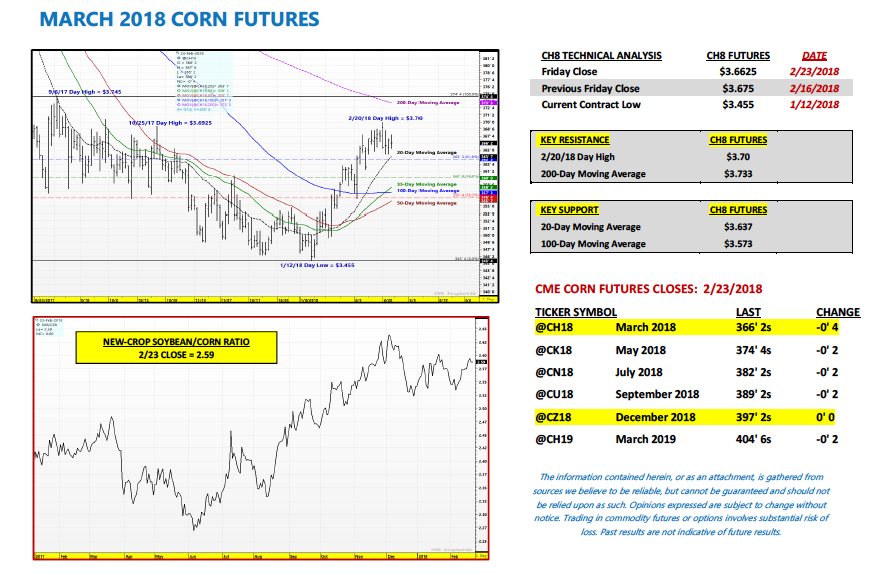
March corn futures traded up to a day high of $3.70 on Tuesday, February 20th. This represented the highest tick in March corn futures since 9/29/17. For the week however March corn futures closed down slightly, finishing at $3.66 ¼ on Friday afternoon (2/23).
Friday’s Commitment of Traders report showed Money Managers now carrying a net LONG in corn of +18,674 contracts as of the market close on 2/20. Since January 10th, 2018, Money Managers have bought nearly 246k corn contracts, which has in turn generated a rally of 24 ½-cents per bushel from the day low of $3.45 ½ on 1/12 to the day high of $3.70 on 2/20. I would call that fairly disappointing if you’re a Corn Bull. However ultimately what it speaks to is all the producer corn being sold (and hedged) on even small rallies.
I remain of the opinion that corn rallies in excess of $3.70 (on March corn futures) will be difficult to sustain at this time. Corn Bulls seem to be pinning their hopes on the continuation of good weekly export sales (further deterioration in Brazil’s corn production estimates), as well as, strength in soybeans pulling corn higher. However I think the improvement in exports has already largely been priced in. And as it relates to soybeans, I think the soybean market is close to rolling over as well after rallying nearly $1.00 per bushel since 1/12.
Next week March corn futures need to hold the 20-day moving average at $3.637 to avoid a potential quick sell-off back down to the 35-day moving average at $3.582. If corn is going to sustain this up move…it needs to hurry.
Twitter: @MarcusLudtke
Author hedges corn futures and may have a position at the time of publication. Any opinions expressed herein are solely those of the author, and do not in any way represent the views or opinions of any other person or entity.
Data References:
- USDA United States Department of Ag
- EIA Energy Information Association
- NASS National Agricultural Statistics Service


 Rolling Over At Key Fibonacci Level?")

