Shortly after the novel coronavirus hit the news (ie. COVID-19), everyone rushed out for toilet paper, paper towels, shelf stable goods, and any thing that was deemed “essential”.
Well, that pretty much sums up the retail products in the consumer staples sector and stocks.
The Consumer Staples Sector ETF (XLP) crashed initially with the rest of the stock market, but then surged back. And persistent buying has taken this defensive (and oft slow-moving) sector to new highs.
That said, it recently stalled out and is trading sideways with mixed signals. Today we look at XLP’s “weekly” and “daily” charts and highlight some guideposts to watch. A strengthening economy and pullback in consumer staples could mean normalization is here… whereas a breakout to new highs may mean another round of fear and concern is in order.
Note that the following MarketSmith charts are built with Investors Business Daily’s product suite.
I am an Investors Business Daily (IBD) partner and promote the use of their products. The entire platform offers a good mix of technical and fundamental data and education.
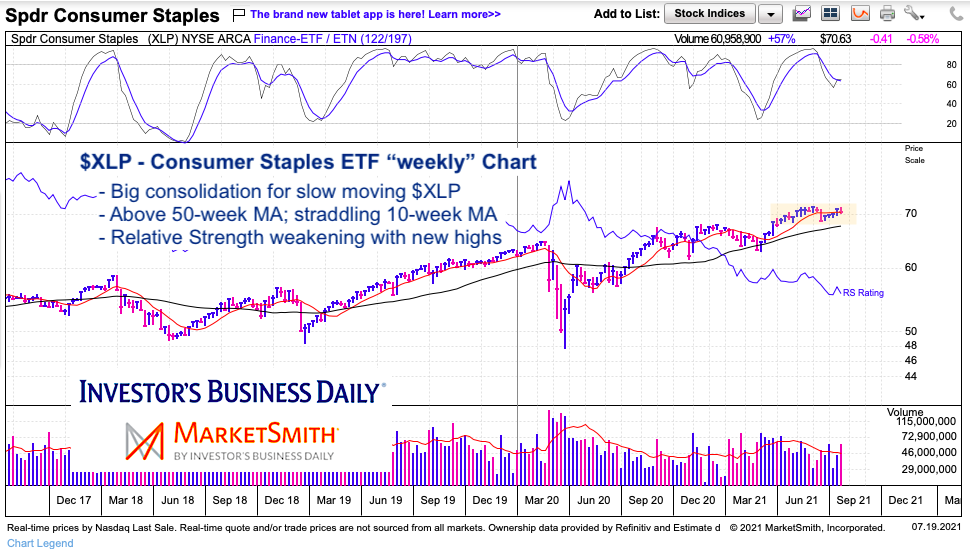
$XLP Consumer Staples ETF “weekly” Chart
The past several weeks have seen XLP consolidate and pullback. This is a good sign for normalization but price is caught in a 3 month sideways pattern.
Bullish signals: Price is above the 50-day moving average (broader bull market trend intact). Momentum is attempting to turn higher.
Bearish signals: Relative strength is weak while price is near highs (divergence).
Sitting on 10-week moving average. 50-week moving average important trend watch.
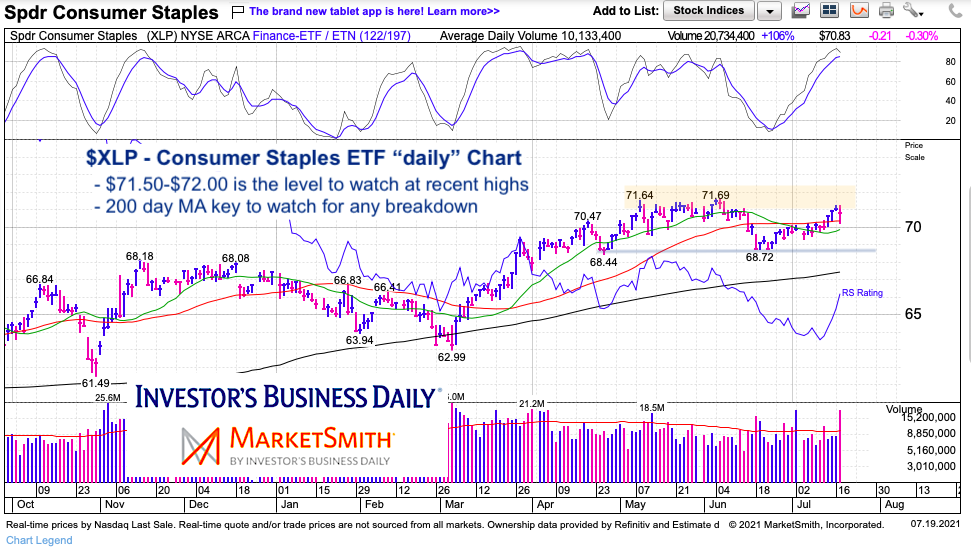
$XLP Consumer Staples ETF “daily” Chart
On the “daily” chart we can see that the $71.50 to $72.00 area is important resistance. 20/50 day moving averages are support confluence. Then 200-day moving average. Short-term “daily” chart shows momentum slowing from recent move higher.
Twitter: @andrewnyquist
The author may have a position in mentioned securities at the time of publication. Any opinions expressed herein are solely those of the author, and do not in any way represent the views or opinions of any other person or entity.


")


