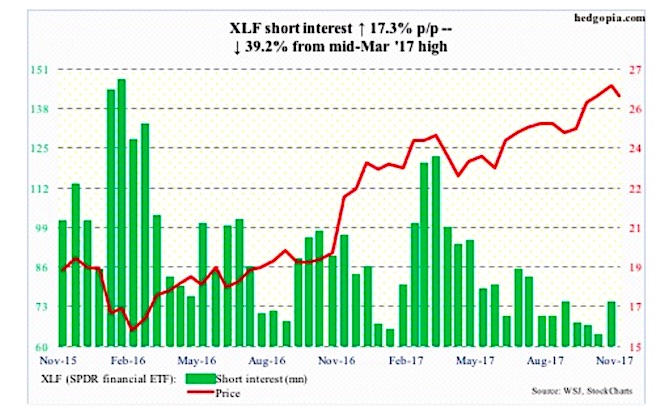
S&P Sector ETFs: The Latest Long & Short Interest
The following data, analysis, and charts highlight long and short interest as of October 31, 2017 across several S&P 500 Sector ETFs. Note that...
[VIDEO] Rare Set Of Bullish Stock Market Signals Trigger
The past week has once again seen several major media headlines hinting at market tops and extremely bearish outcomes. This wouldn't be so hard...
S&P 500 Weekly Market Outlook: The Rally Is Out Of Sync
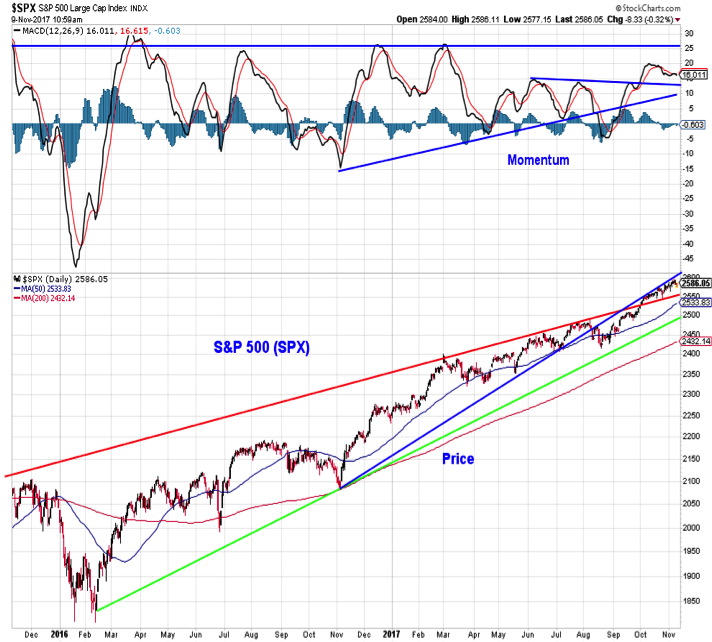
In this week’s investing research outlook, we examine current trends for the S&P 500 Index (INDEXSP:.INX) and Russell 2000 (INDEXRUSSELL:RUT), while checking in on stock market breadth and...
This Indicator Could Trigger A 20% Stock Market Correction
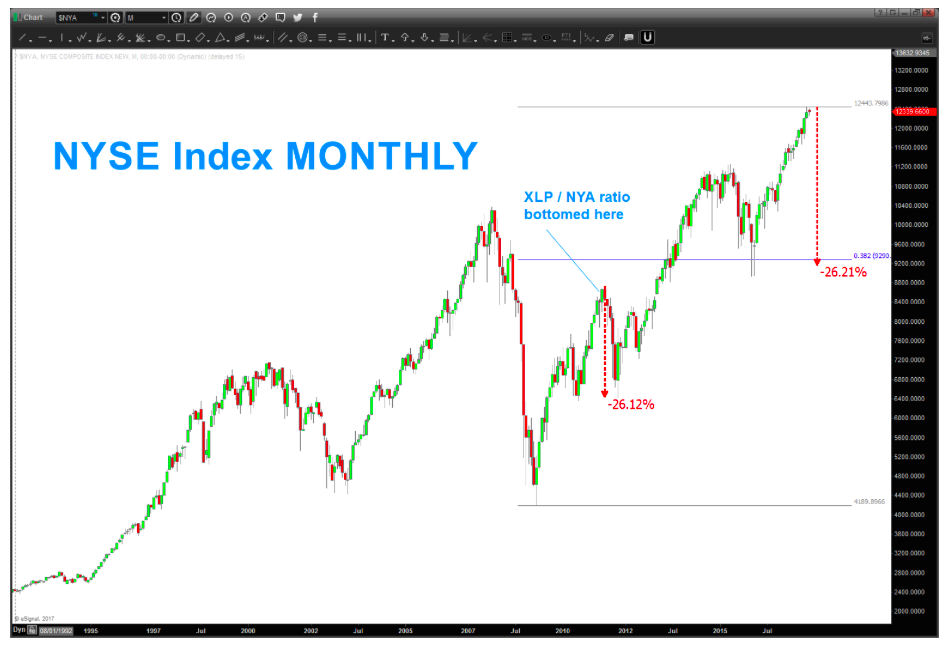
For the past several weeks, I have been honing in on an important stock market ratio / indicator. This indicator is the ratio performance...
Global Investing Insights: 5 Macro Themes I’m Watching
The markets continue to be noisy and indicators are mixed for equities. There's reason to be on alert as this rally is getting extended.
But...
S&P 500 Trading Update: This Market ‘Bears’ Watching
S&P 500 Trading Outlook (2-3 Days): BEARISH
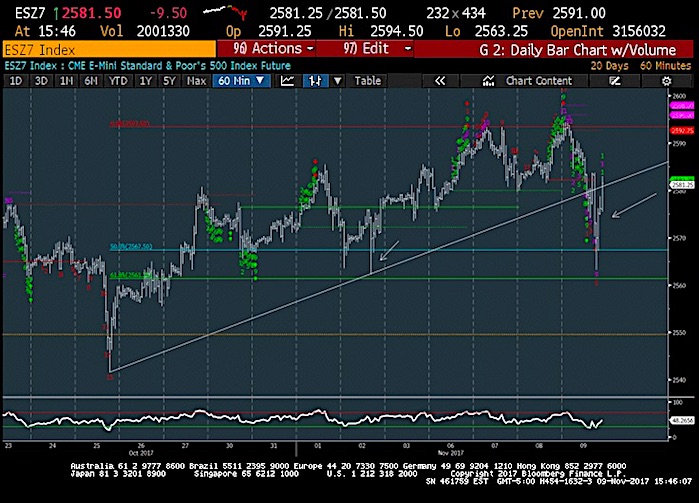
The S&P 500 (INDEXSP:.INX) declined sharply yesterday but managed to hold right where it needed to. It literally came within...
I See London, I See France, Viva La Stock Market Resistance?
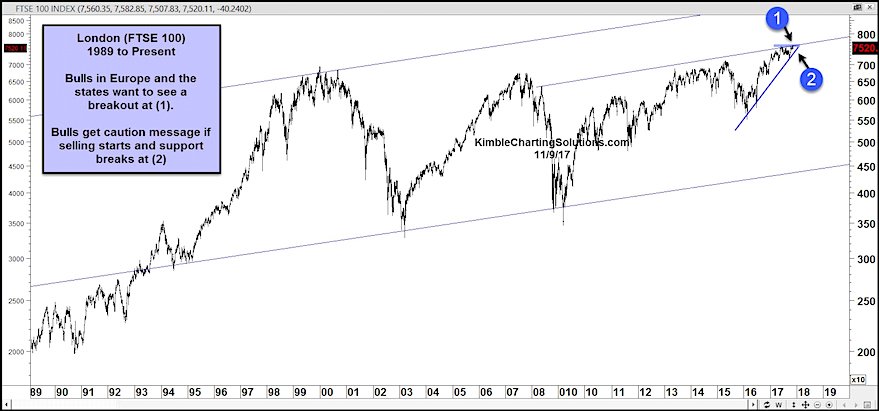
Two international stock markets that have interesting charts right now are London's FTSE 100 Index (INDEXFTSE:UKX) and France's CAC40 Index (INDEXEURO:PX1).
Both have been in...
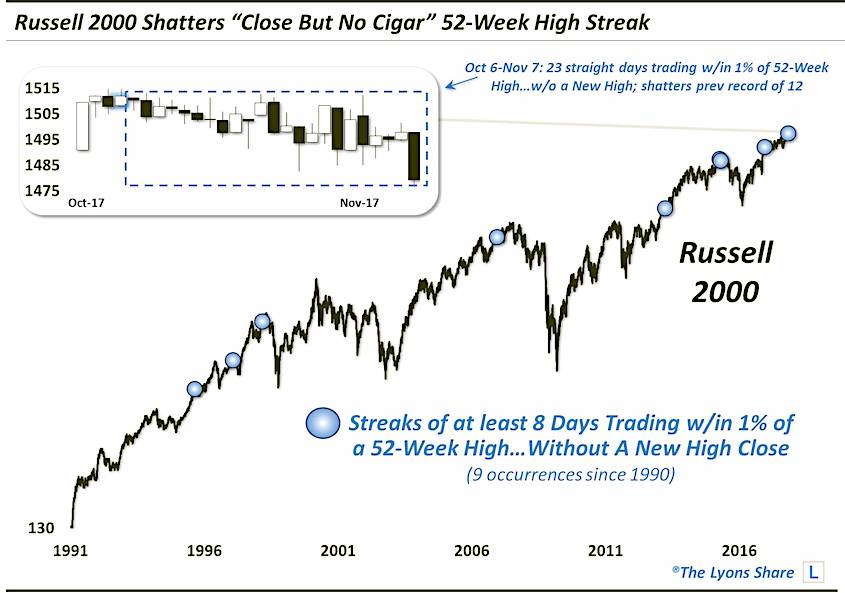
Russell 2000 Sets Record: Near Highs… But No New Highs
The Russell 2000 just spent over a month within 1 percent of its 52-week high, without achieving a new high – a streak twice...
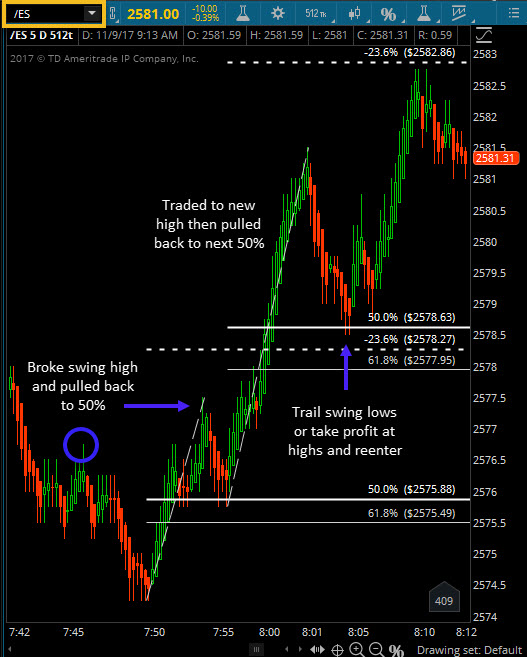
S&P E-Mini Morning Trading: Here’s Why I Trade Fibonacci Levels
Whether you're a new trader (or just new to day trading) the first thing that becomes clear is that the market doesn't just go...
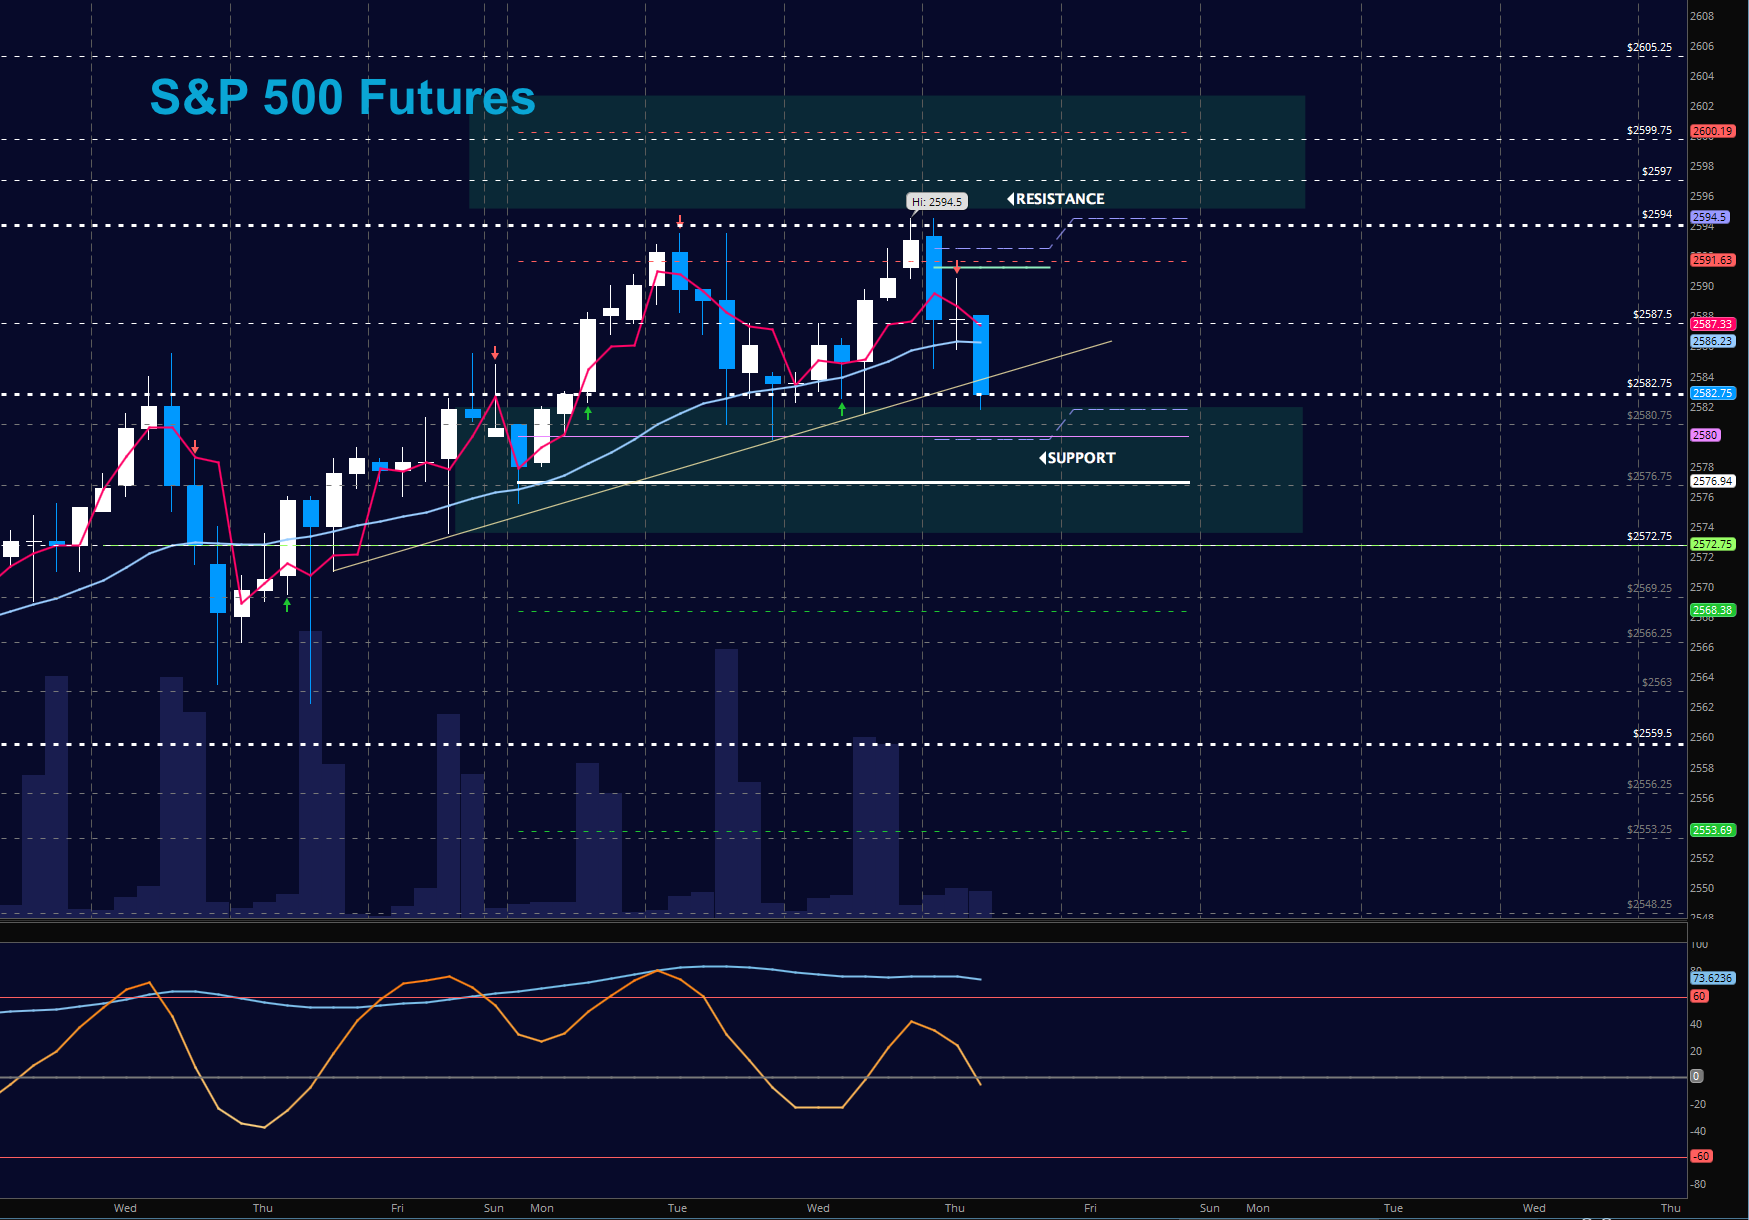
S&P 500 Futures Trading Outlook For November 9
S&P 500 Index Chart - November 9
Stock Market Futures Trading Considerations For November 9, 2017
The S&P 500 (INDEXSP:.INX) is trading lower on Thursday morning,...

![[VIDEO] Rare Set Of Bullish Stock Market Signals Trigger](https://www.seeitmarket.com/wp-content/uploads/2017/11/rare-stock-market-bullish-indicator.png)
