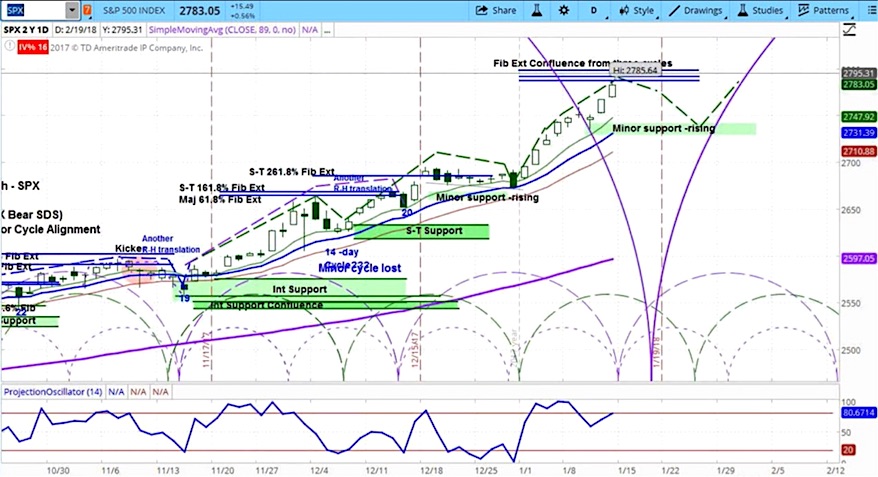
S&P 500 Weekly Outlook: Market Cycles Point To A Pullback
The stock market has been "off to the races" to start 2018, as the S&P 500 is testing the 2800 price level.
Stock prices continue...
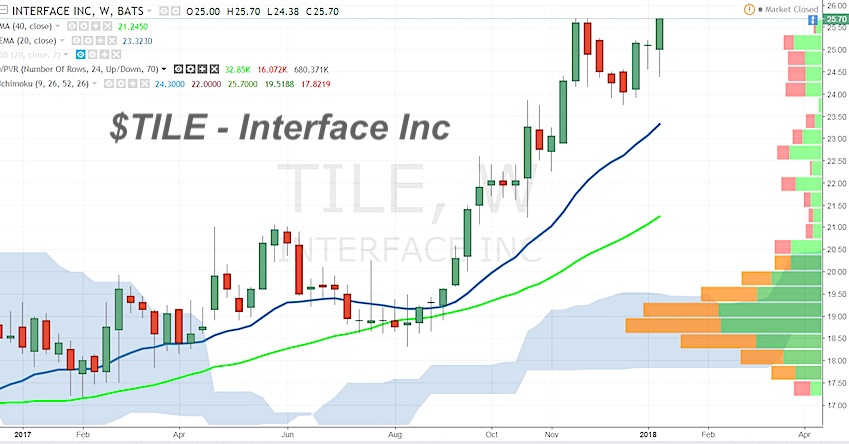
Interface (TILE): Strong Combination of Fundamentals and Technicals
Interface Inc (TILE)
Interface is a $1.54B maker of modular carpet for commercial and residential markets trading 19X Earnings, 1.59X Sales and 41.83X FCF with...
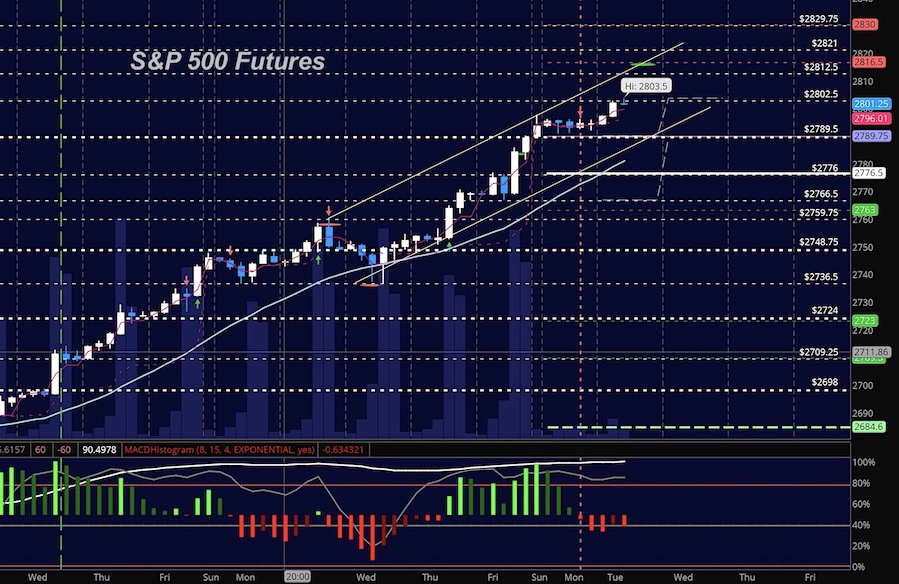
Stock Market Futures Trading Update: Watch Those Divergences!
Market Outlook for January 16, 2018
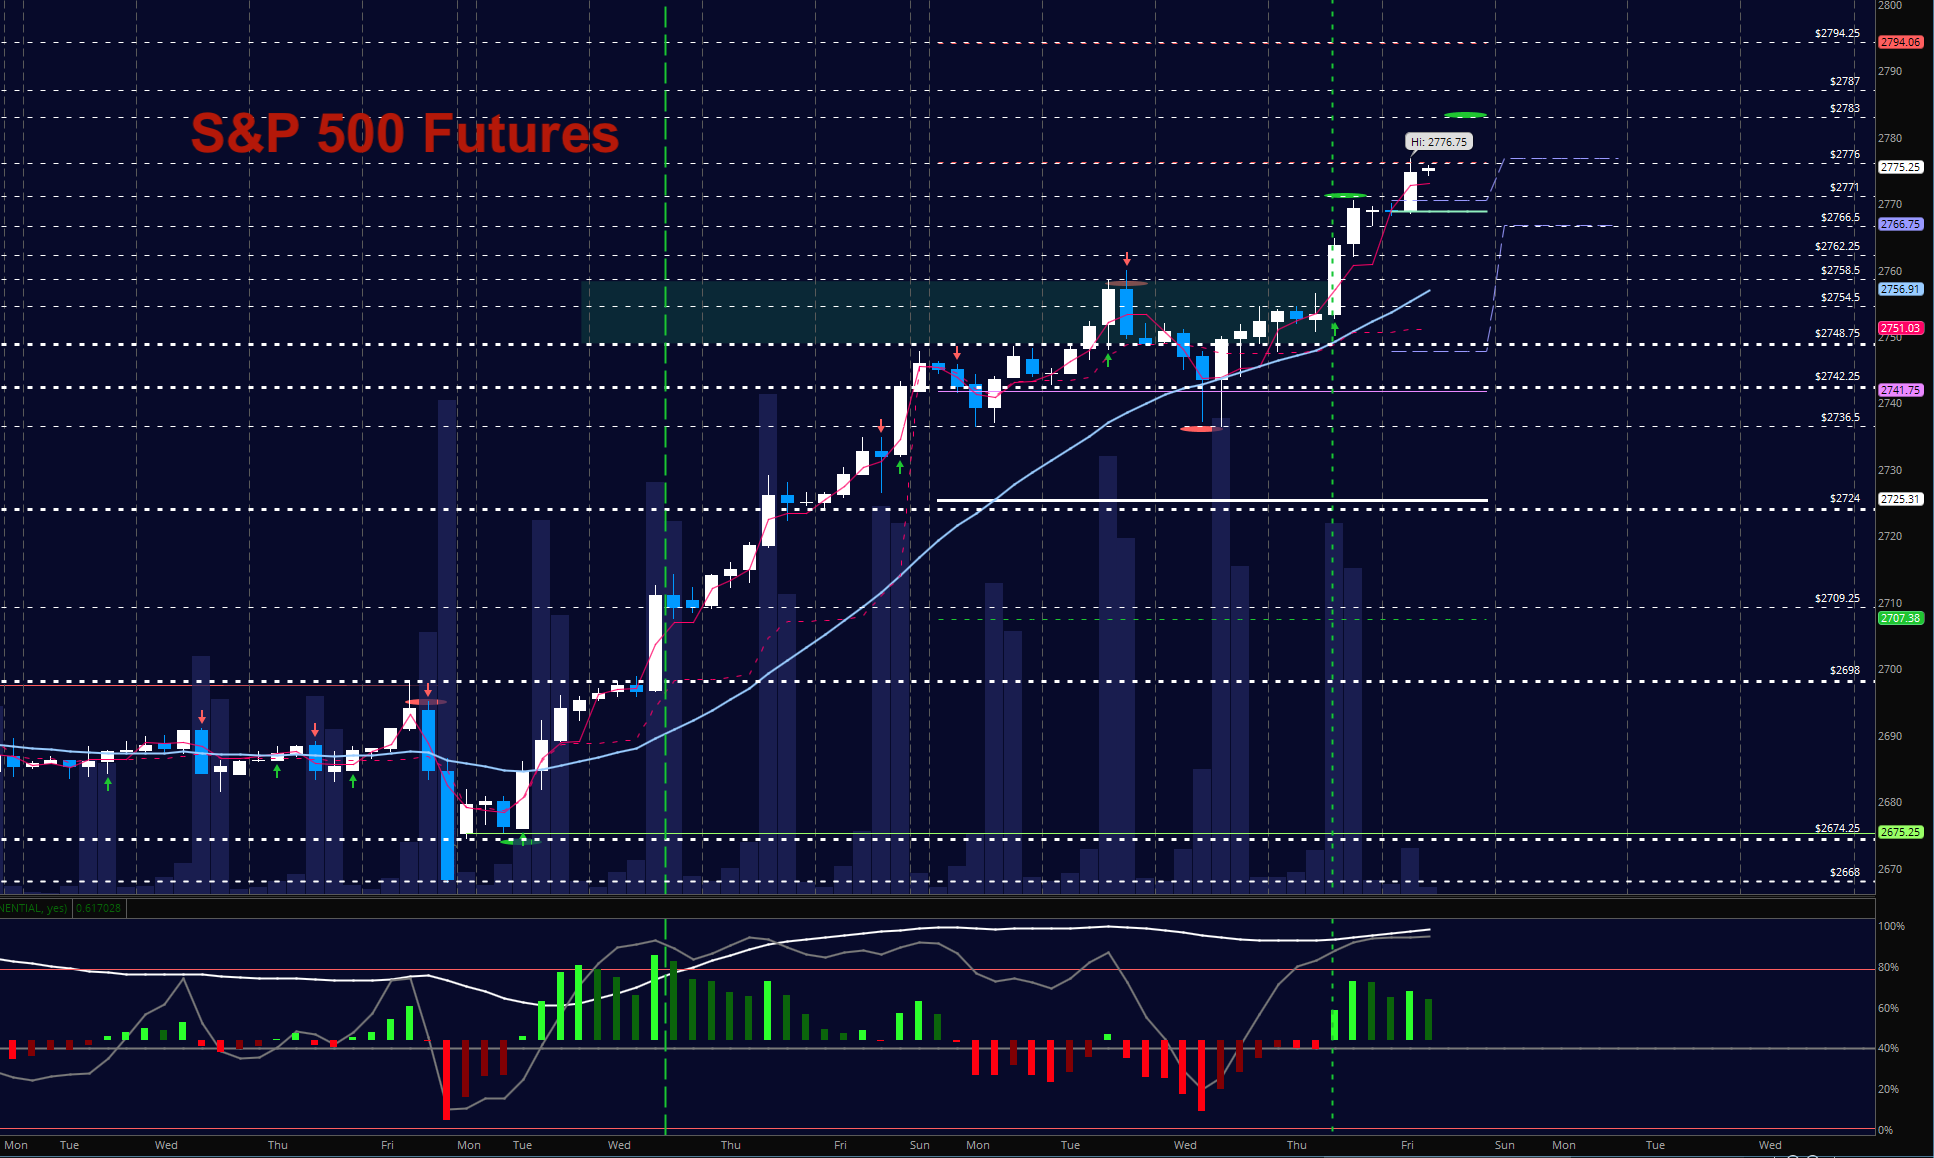
The S&P 500 and broad market indices are seeing some bullish continuation after the long holiday weekend. However, there is...
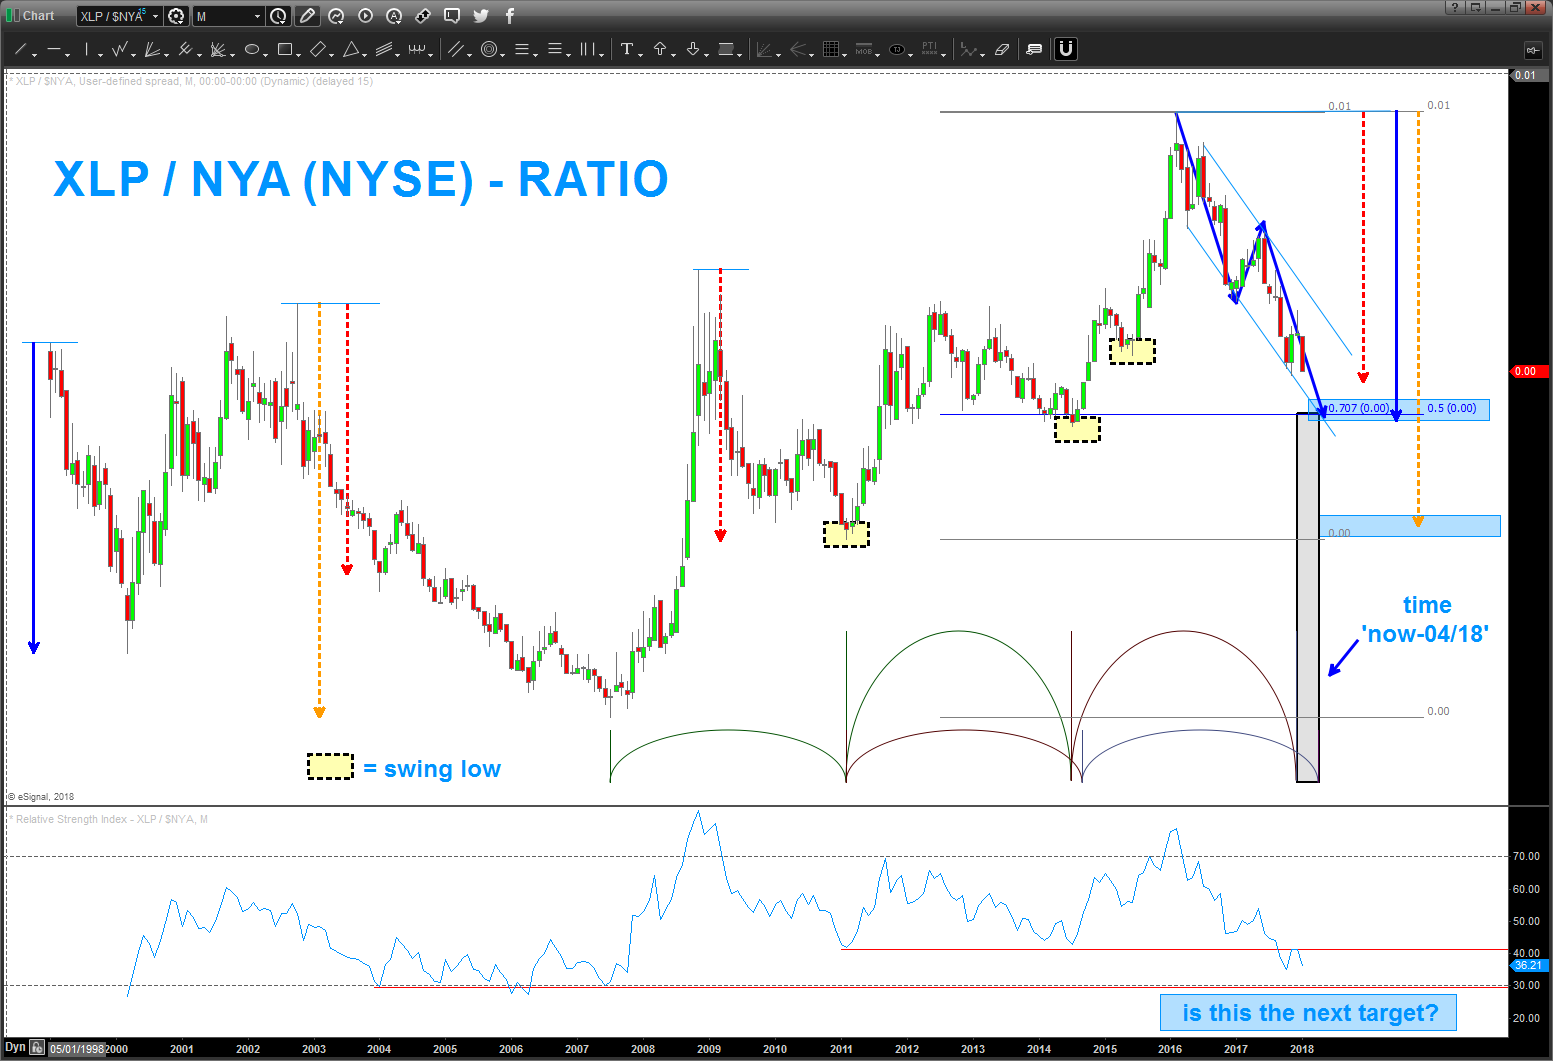
Market Update: Consumer Staples (XLP) / NYSE Composite Ratio
The last time we blogged about this important ratio, we highlighted an important juncture for the market's next move.
While the targeted price level did...
Is CAPE Valuation Indicator Portending Bad Things For Stocks?
In this week's market video, we analyze Shiller's PE, or the Cyclically Adjusted Price Earnings Ratio (CAPE).
Stock valuation measures are generally poor indicators for market...
Stock Market Weekend Update: Near-Term Concerns Bubble Up
The market has been very strong to start 2018 but there are a few near-term concerns bubbling up. Investor sentiment has become overheated, the...
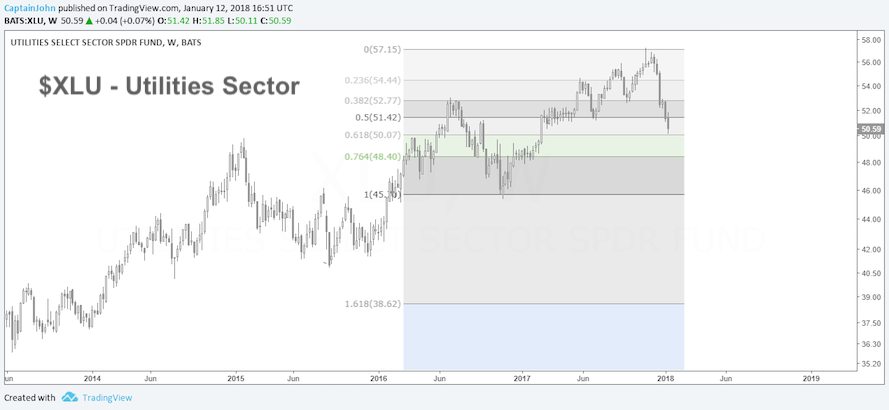
Utilities Sector ETF (XLU) Looks Ready To Bounce
The Utilities Sector ETF (XLU) has been in a pretty good correction over the past several weeks.
Could that be coming to an end? At...
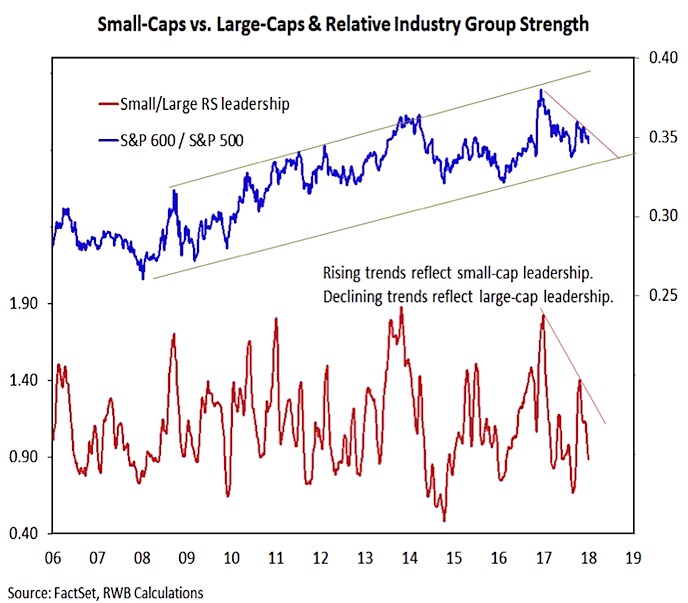
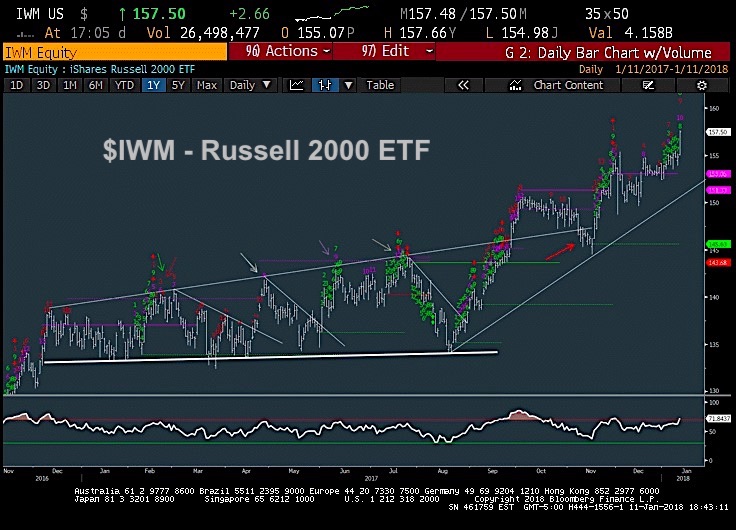
Russell 2000 Spotlight: Small Cap Stocks Outperforming
The Russell 2000 and small (and micro) cap stocks have been outperforming of late.
This pick up in near-term strength bodes well for small caps...
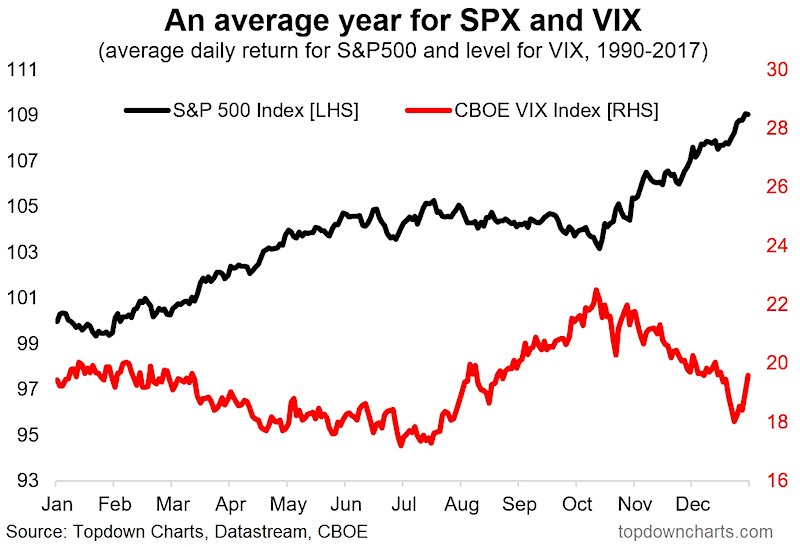
Market Seasonality Composite Charts For Stocks & Bonds
Earlier this week, I shared some stock market seasonality charts on my research blog and Twitter feed. I'd like to highlight a couple of...
Stock Market Futures Trading Outlook For January 11
Stock market futures are pushing slightly higher in early trade as buyers continue to show demand.
That said, we are at a juncture that requires...

