Equity Markets Show Their Hand: Growth Over Income
GROWTH IN ISOLATION
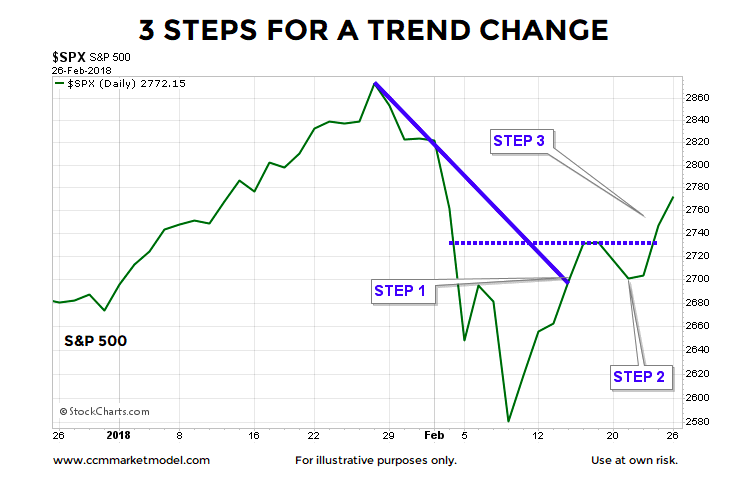
A July 2013 See-It-Market post outlined the three steps required for a trend change.
The S&P 500 recently broke the downward-sloping trend line below (step...
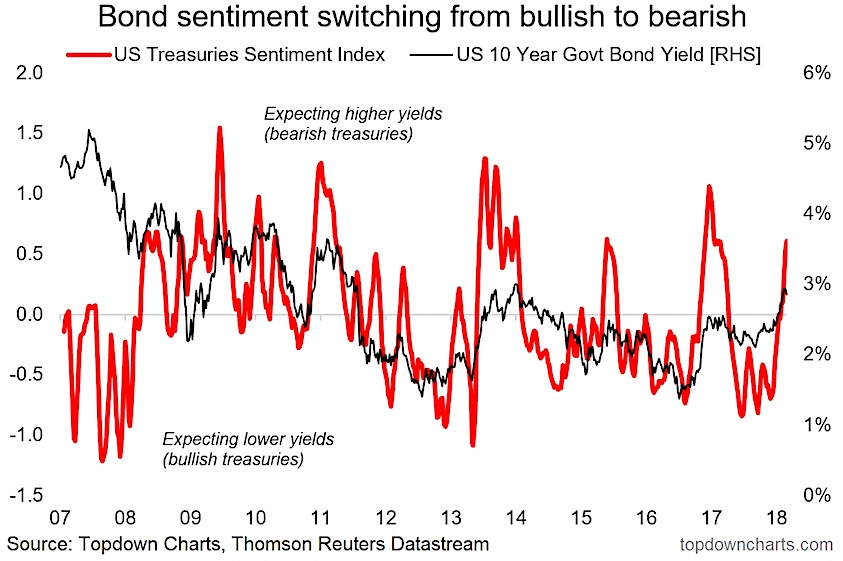
U.S. Treasuries: Too Far Too Fast?
Since the September low point last year US 10-Year treasury bond yields have risen 90bps, this compares to 125bps from the low point in...
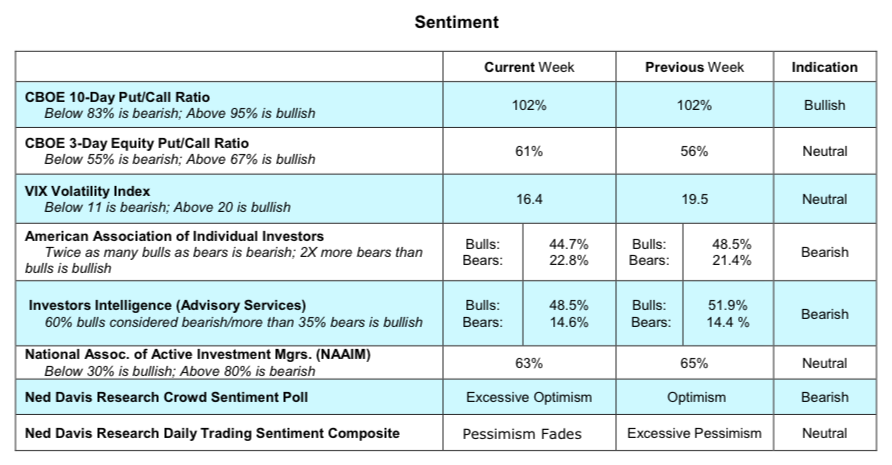
U.S. Equities Update: Investors Shrug Off Inflation Concerns
The equity market rallied for the second week in a row last week with the S&P 500 Index gaining more than 50 basis points....
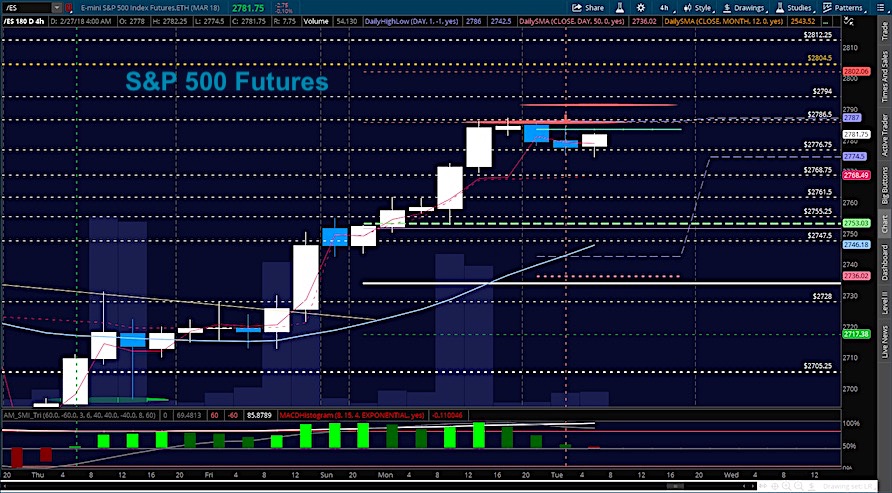
S&P 500 Futures Update: Bulls/Bears Set To Clash At Resistance
Broad Stock Market Outlook for February 27, 2018
Market Momentum pointed the way yesterday as the S&P 500 tested and retested resistance to push into pivot...
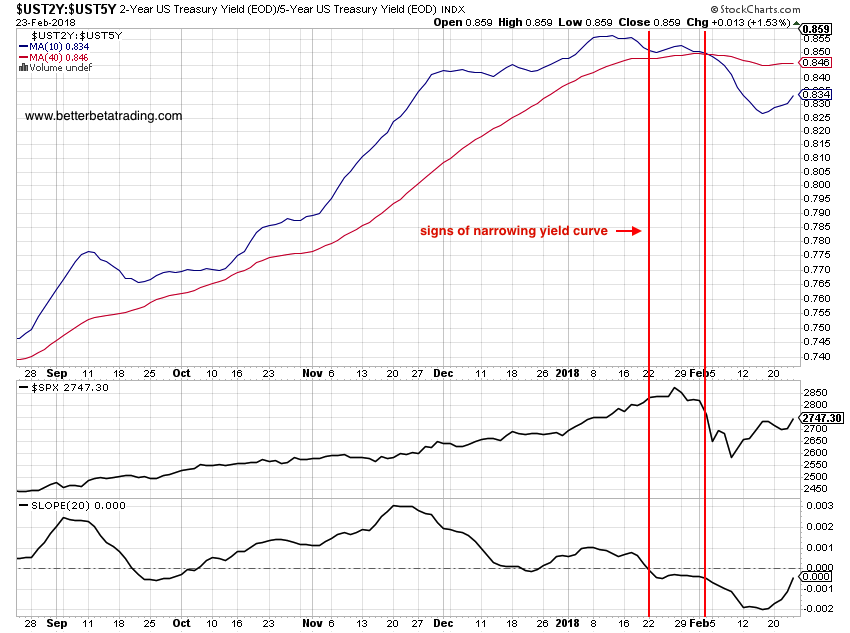
How To Use The Yield Curve As An Equities Risk On/Off Indicator
The drop in equity markets and subsequent V-shaped rebound has left many traders wondering: "Is it safe to increase long equity exposure?"
With pundits on...
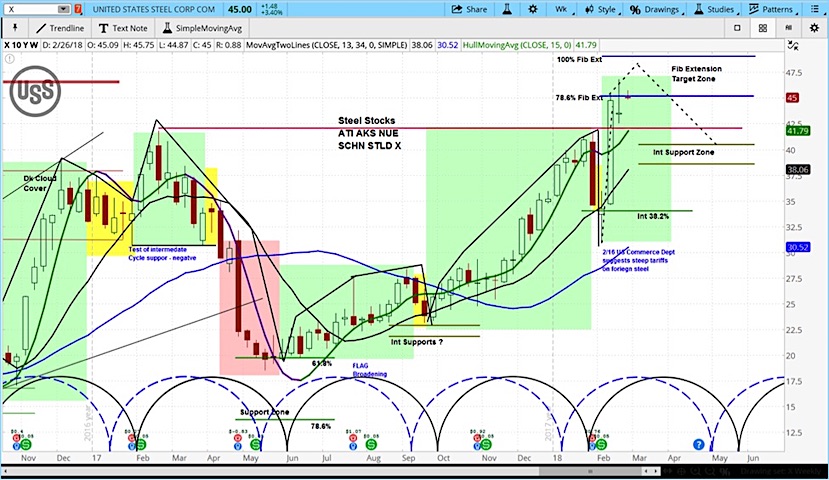
US Steel (X) Rallies On Trump Tariffs, But Stock Faces Near-Term Headwinds
US Steel (X) gapped higher on Monday morning, up around $1.20 to $44.72 which is a 2.5% increase but up as high as 4%...
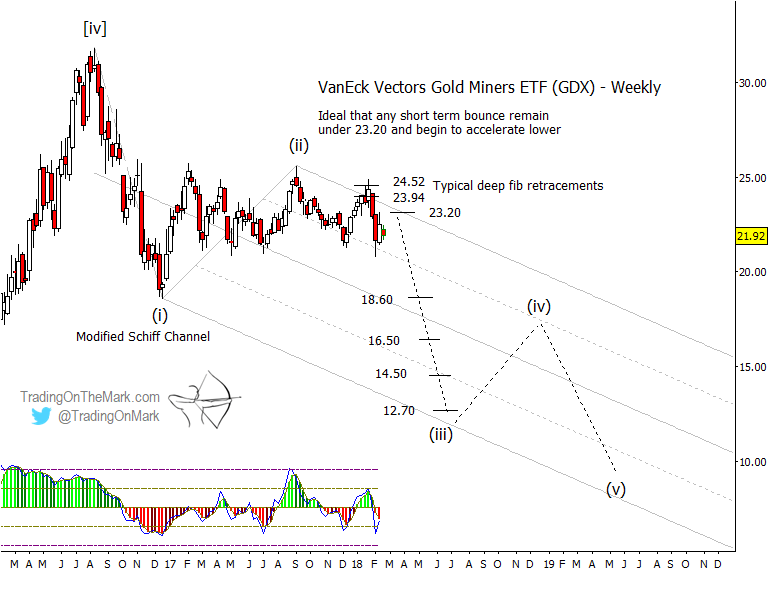
Gold Miners (GDX) Elliott Wave Forecast Points Lower Yet
In December, we highlighted a potential trade developing in the VanEck Vectors Gold Miners ETF (NYSE Arca: GDX). Since that article was posted, we...
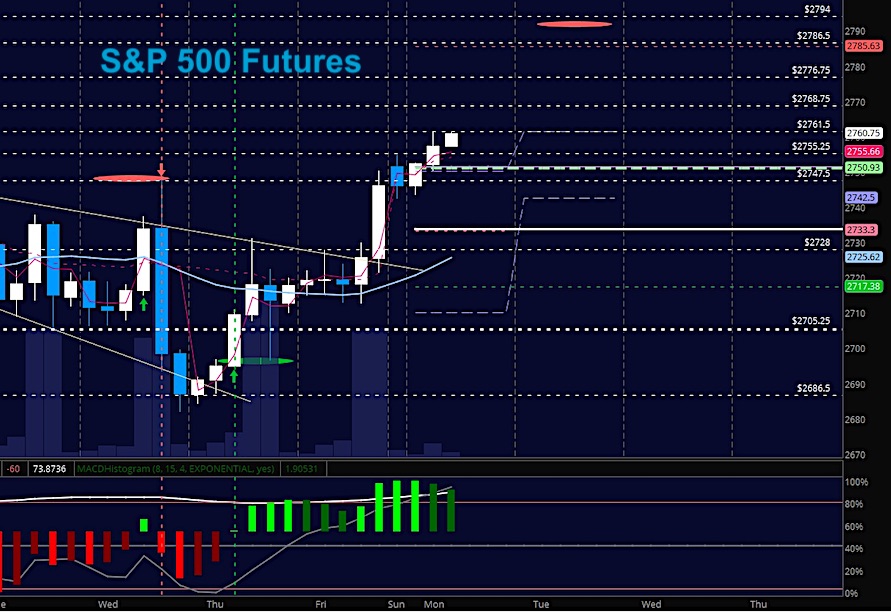
S&P 500 Futures Update: Signals Pointing North Today
Broad Stock Market Outlook for February 26, 2018
S&P 500 futures sit above important price support of 2705. The market is also support by the fact...
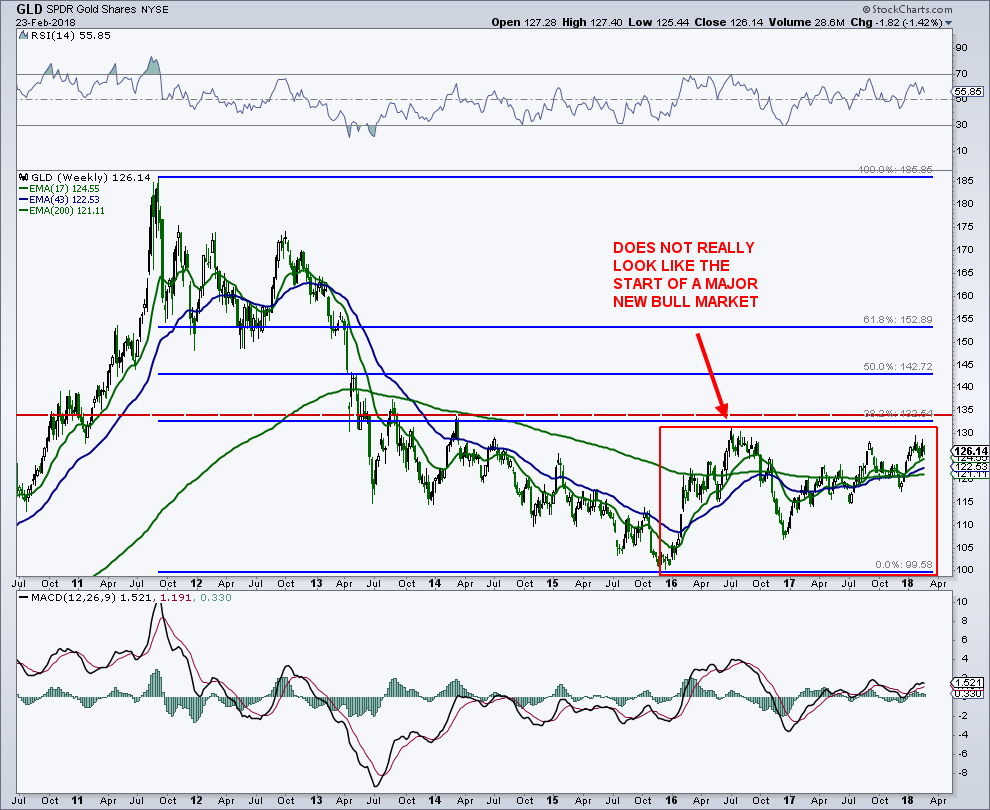
New Gold Bull Market Starting? Not So Fast…
Today, I want to provide a quick update on gold trading and the iShares Gold Trust (GLD). Gold has been meandering beneath major price...
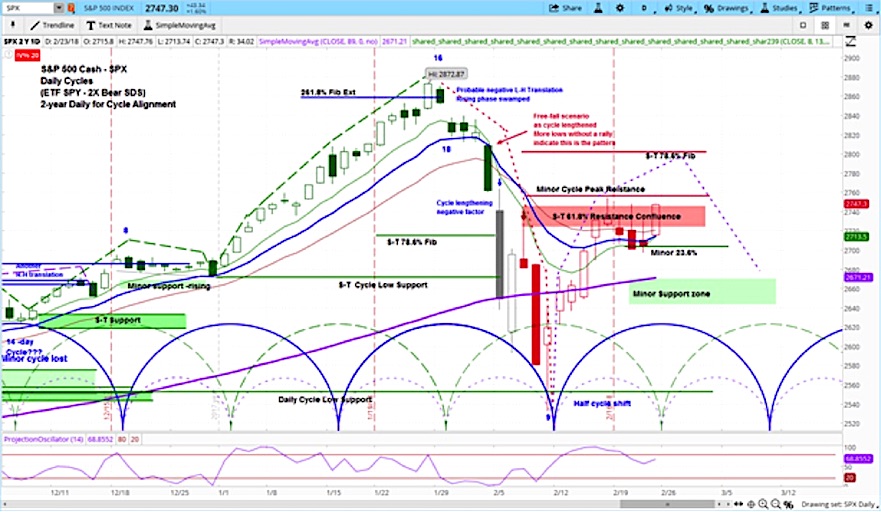
Market Outlook: Stocks Set To Continue Bounce, Then Fail
The S&P 500 reversed course on Friday and rallied back to new 3-week closing highs.
Look for stocks to extend gains into this week before...

