Global Equities Market Breadth Breakdown
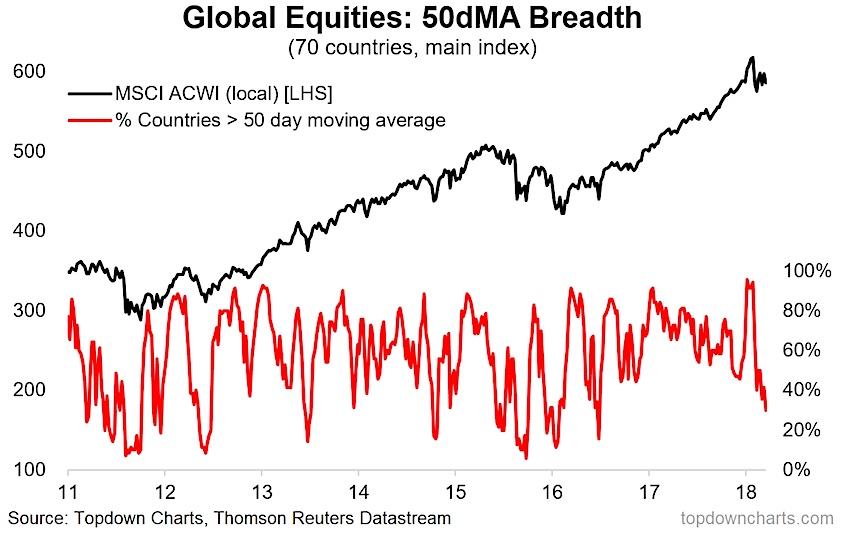
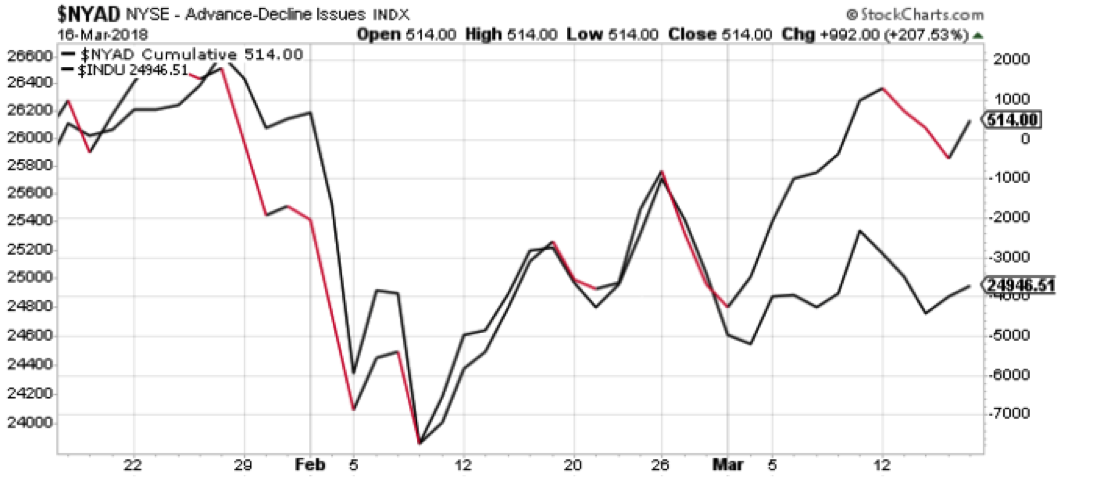
The latest price action across global equities has driven a deterioration in market breadth.
The 50-day moving average breadth indicator for the 70 countries we...
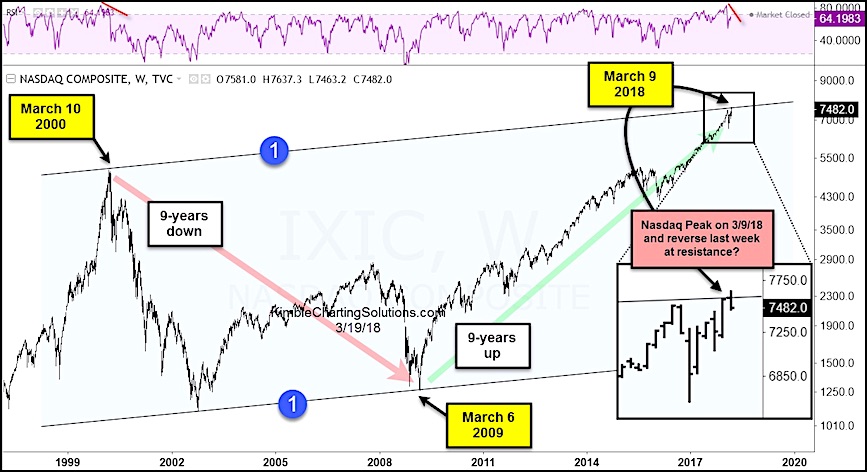
Is The Nasdaq Market Ride Over? Watch Those Divergences!
The latest leg higher in the bull market (off the 2016 lows) has been lead by the Technology sector and Nasdaq Composite.
FANG stocks (Facebook,...
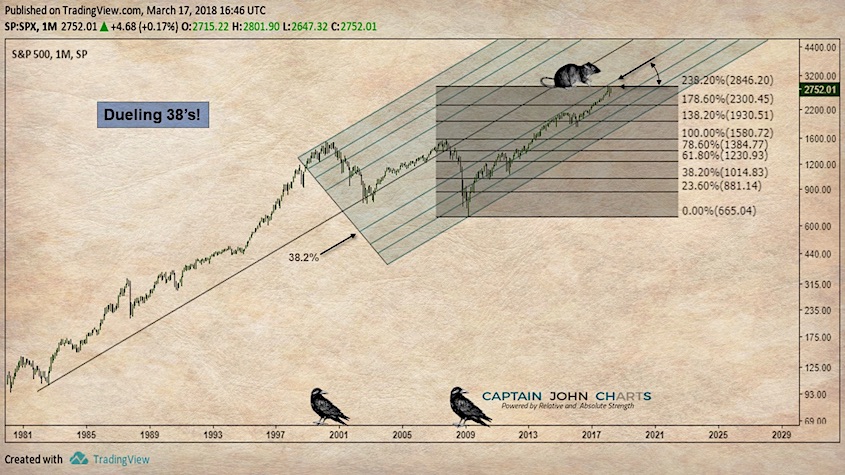
S&P 500 Correction Chart: Another Pitchfork In The Road
Last week, I shared a chart that started an Andrew's pitchfork off the 1987 lows. The purpose of that post was to highlight potential...
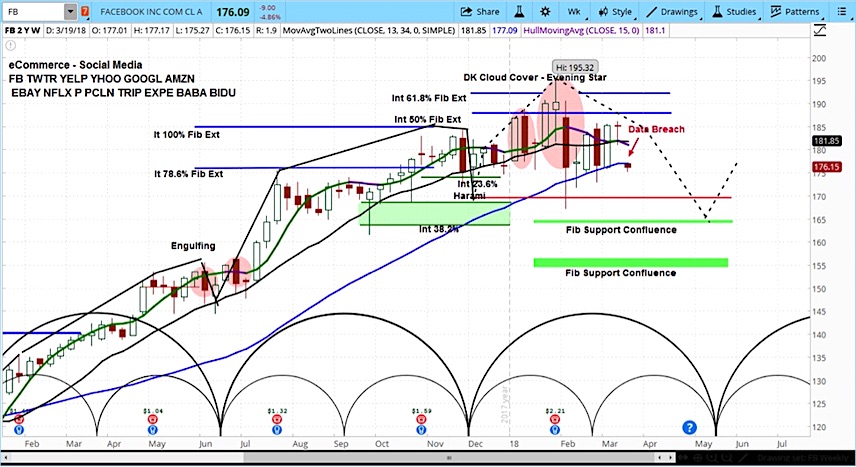
Facebook Stock (FB) Declines, Still Has Room To Drop
Facebook (FB) shares are trading 6% lower on Monday morning, after news reports that the company may have improperly handled a potential “breach” of...
Stock Market Trends Update & Outlook (Week 12)
Investors are still operating in a climate that is prone to volatility so it pays to stay focused on stock market trends within your...
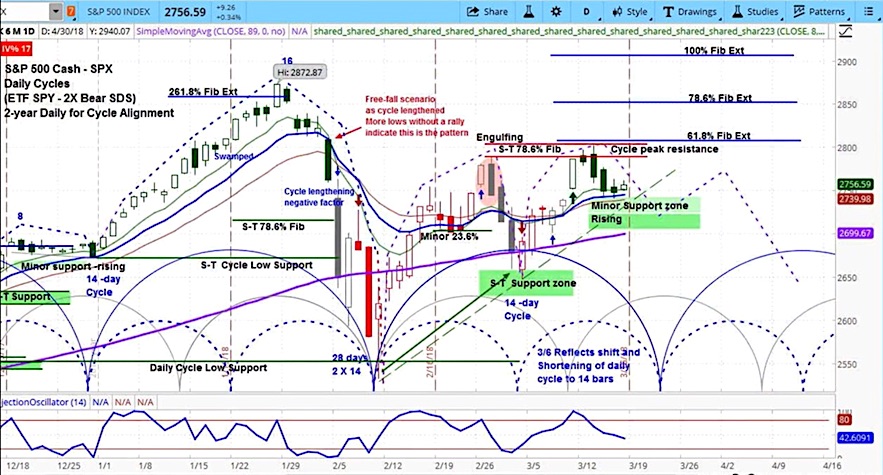
S&P 500 Weekly Market Outlook: Stocks Face More Risk
The S&P 500 price movements over the past several weeks highlight the risks of a volatile trading environment for traders.
During this period of correction...
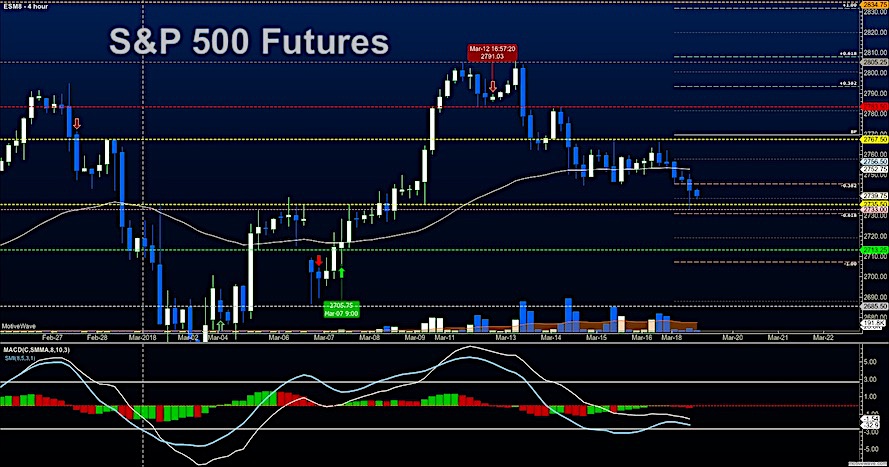
S&P 500 Futures Trading Outlook: Can Bulls Defend 2734?
Broad Stock Market Outlook for March 19, 2018
Charts are at important support levels and there should be some measure of argument between buyers and sellers...
Stock Market Video: The Difference Between Big Gains & Losses
THE FINE LINE BETWEEN WINNING AND LOSING
Have you ever looked back after the market gains 20% and said to yourself how did I not...
Boeing (BA): Will This Market Leader Take The Dow Industrials Lower?
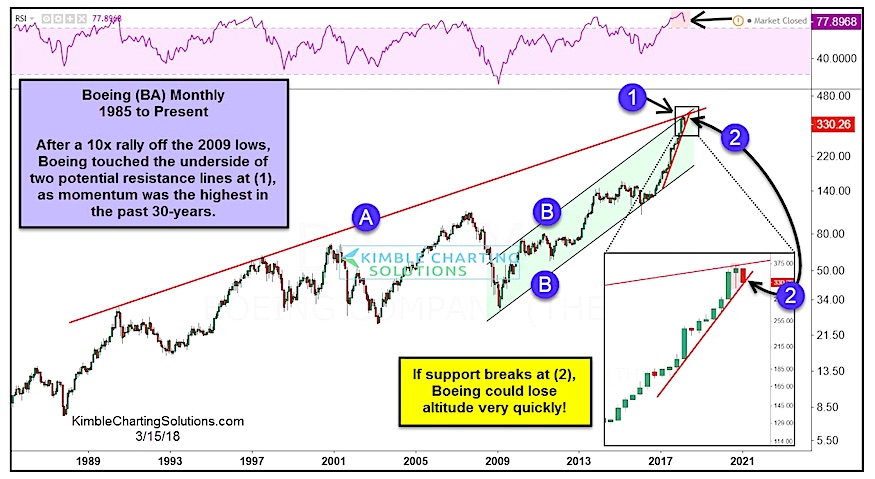
Boeing (BA) has been a major bull market momentum leader for the Dow Jones Industrial Average.
As you can see in the chart, it rocketed...
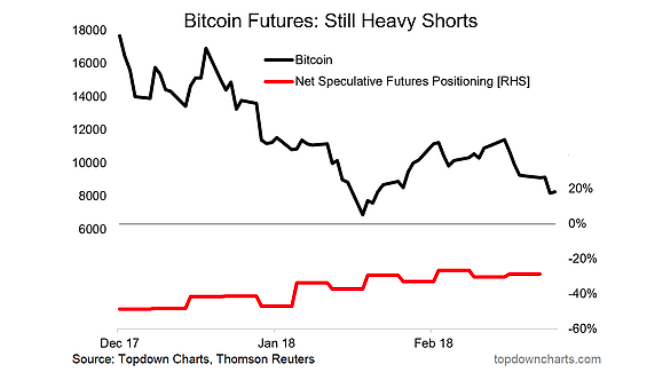
Bitcoin Research Update: Sentiment, Seasonality, and Technicals
Over the past several months, we've slowly built up some Bitcoin research indicators (and others focused on the cryptocurrency market).
As most of our clients...

