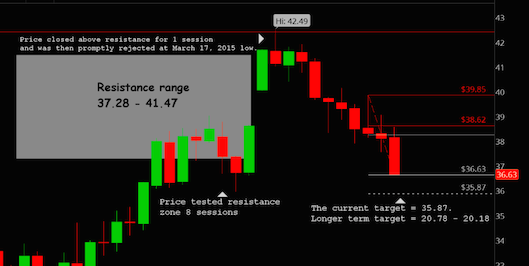
Crude Oil Update: Why Fibonacci Price Targets Matter
In January of 2016, I wrote an article on Crude Oil Futures where I identified a resistance zone of 37.28 to 41.47 using my Fibonacci...
Top Trading Links: Bulls Snort, Bears Go Short
The broader stock market indices closed the week at yearly highs as traders continued to bid equity higher. The reversal has been much stronger than...
US Corn Weekly Report: Prospective Plantings Report Rocks Market
The USDA did not disappoint for those traders hoping for the unexpected and a market shock via the March 31st Prospective Plantings report. 2016 U.S....
Is The Federal Reserve Targeting A Weaker Dollar?
“Manufacturing and net exports have continued to be hard hit by slow global growth and the significant appreciation of the dollar since 2014… Low...
Options Traders Look For Q2 Upside In Biotech Stocks
Biotech was a sector that was a notable laggard in Q1 with the Nasdaq Biotech Sector ETF (IBB) down nearly 24% and S&P Biotech...
Stock Market Futures Rally Off Lower Support
April 1 stock market futures looked lower early this morning as a brief bounce last night on China PMI numbers was sold. The S&P...
Nasdaq Composite Runs Into Major Price Resistance Band
Back on March 2nd, I highlighted some technical reasons why I believed the rally in the Nasdaq Composite had limited upside. I was a...
Apple Stock Chart (AAPL) Across Multiple Time Frames
Apple (AAPL) gets a bit too much credit when its stock is near all-time highs and not nearly enough credit when its out of...
Is The Euro Currency Ready For A Break Out?
The Euro currency (EURUSD) has been in a downtrend since 2008. A struggling euro zone economy and deflationary concerns are the likely culprits. Several...
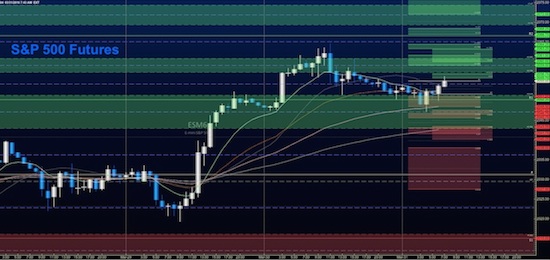
S&P 500 Futures Update: The Chart Looks Tired Near-Term
S&P 500 futures stalled near resistance levels yesterday with the exception of one press upward that failed. And this could be an issue again today...


