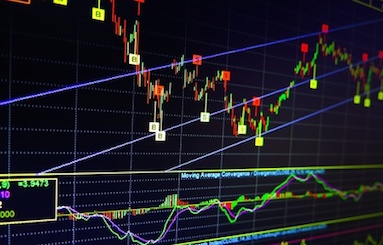
Is The British Pound Downtrend About To End?
Market Inflections on the Great British Pound
Note that this article was co-written with Larry Footer.
Buy fear and sell greed! How many times have we...
How To Fade The NYSE Tick When Trading E-Mini S&P 500
As short-term active traders, we want to enter and exit according to the most relevant information. Earnings and quarterly projects just don't give us...
S&P 500 Futures Trading Outlook For October 14
Stock Market Outlook for October 14, 2016 – A bounce is in play, but 2141 -2144 stands in the way as key price resistance.
The...
5 Reasons Stocks May See More Downside In October
U.S. Equity Markets enjoyed a nice reversal to the upside, but that came along with some technical damage to the charts (and beneath the...
October Stock Market Weakness May Resolve To New Highs
It's been a very sideways stock market this fall. But the monthly transition out of September has seen some October stock market weakness. And...
Treasury Bond ETF (TLT): Rally Brewing But 145 A Big Deal
Treasury Bonds and the 20 Year Treasury Bond ETF (NASDAQ:TLT) have experienced a big selloff this fall. But that may be set to change,...
S&P 500 Futures Trading Outlook For October 13
Stock Market Outlook for October 13, 2016 – Charts lose front line support and are struggling to recapture prior levels.
S&P 500 futures have continued...
Investing Strategy Outlook: Stock Consolidation Likely Into 4Q
Despite increasing levels of news and binary analyst thoughts (noise), stocks appear to be stuck in consolidation mode.
Highlights from our October Investing Strategy Outlook...
Gilead Sciences (GILD): Fundamentals vs Technicals
About $7 ago, I tweeted that Gilead Sciences stock (NASDAQ:GILD) was starting to present a real conundrum of fundamentals/valuation (positive) vs. technicals (negative). So...
S&P 500 Bearish Divergence Raises Intermediate Term Risks
As most active investors are aware, the S&P 500 (INDEXSP:.INX) has traded in a tight range over the past several weeks. Recently, stocks have...


