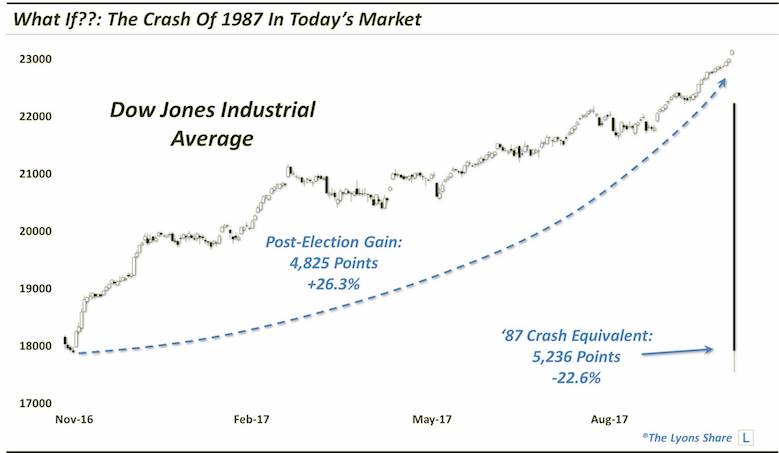
What A 1987 Stock Market Crash Would Look Like Today
On the 30-year anniversary of Black Monday, we take a look at the magnitude of the stock market crash in terms of today’s market.
By...
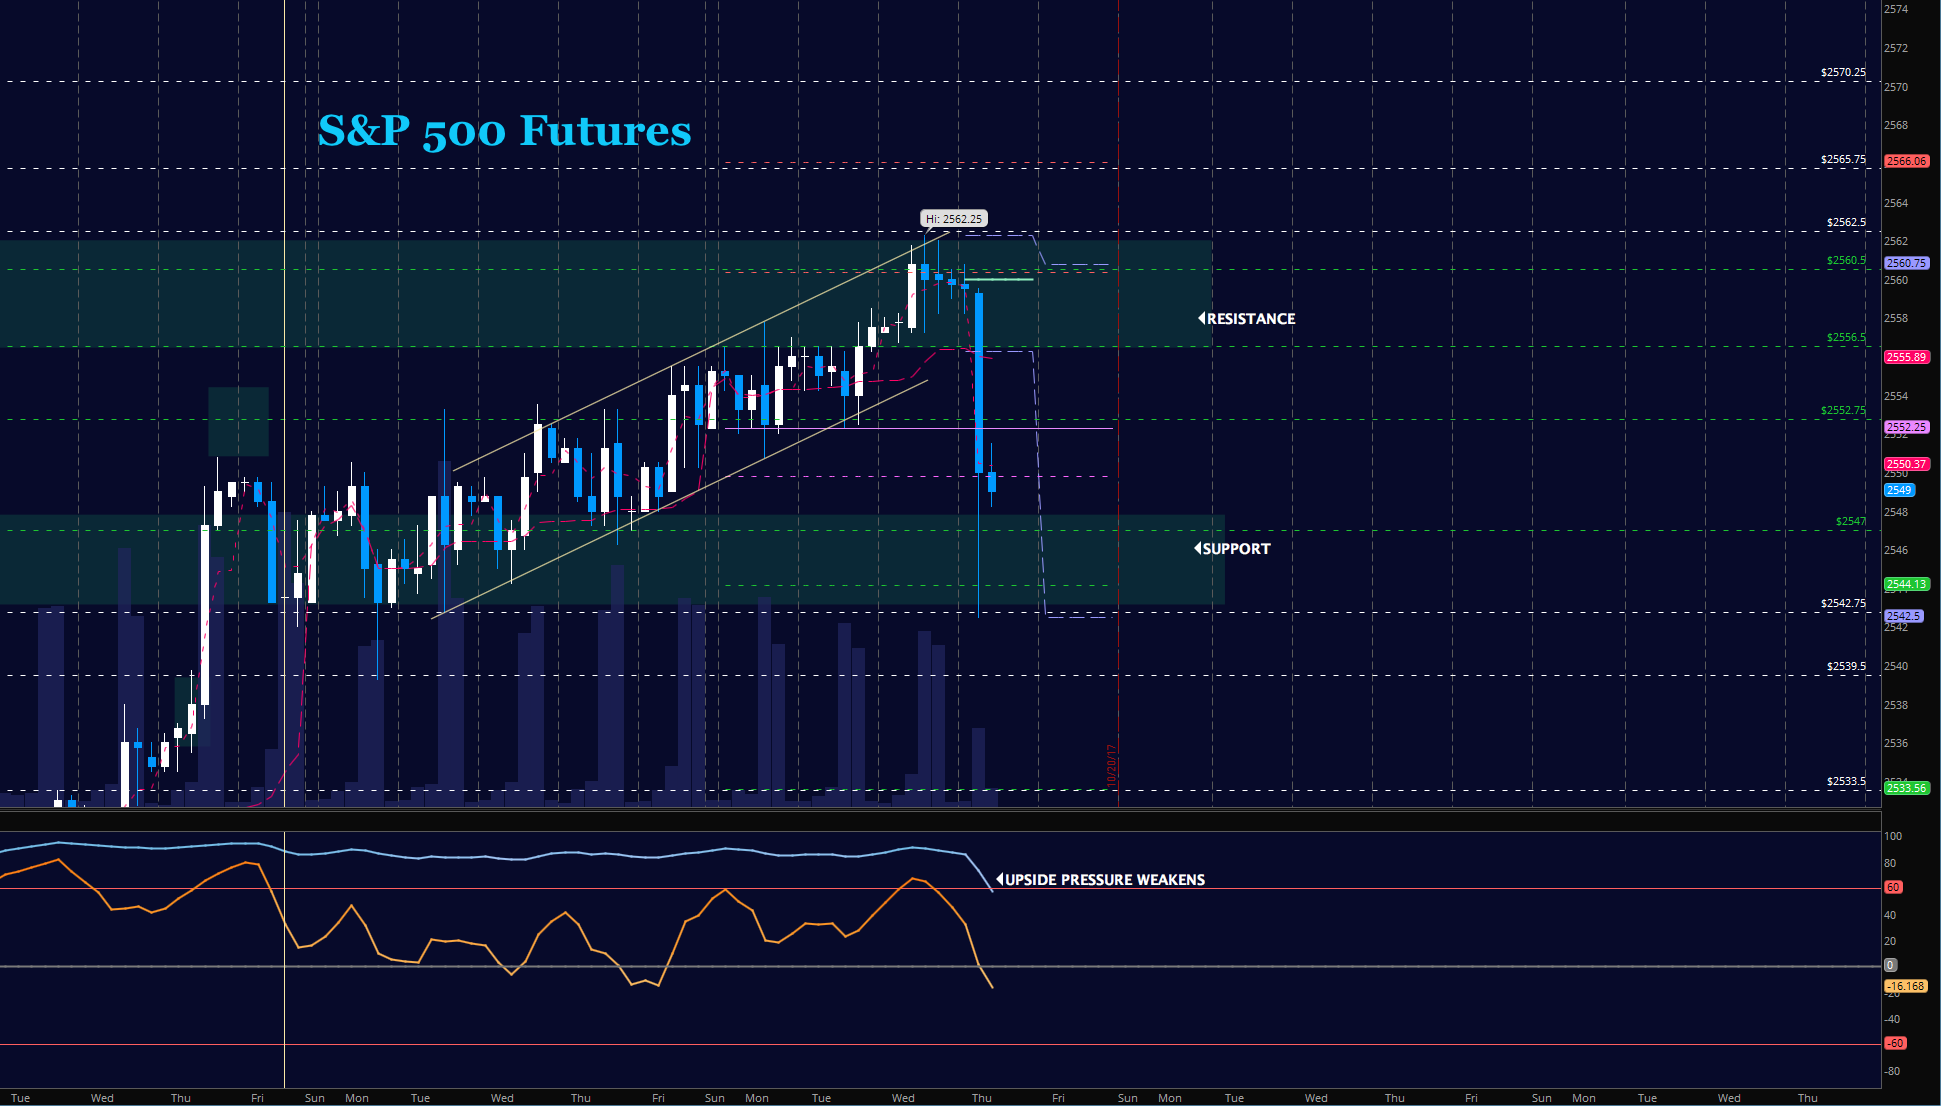
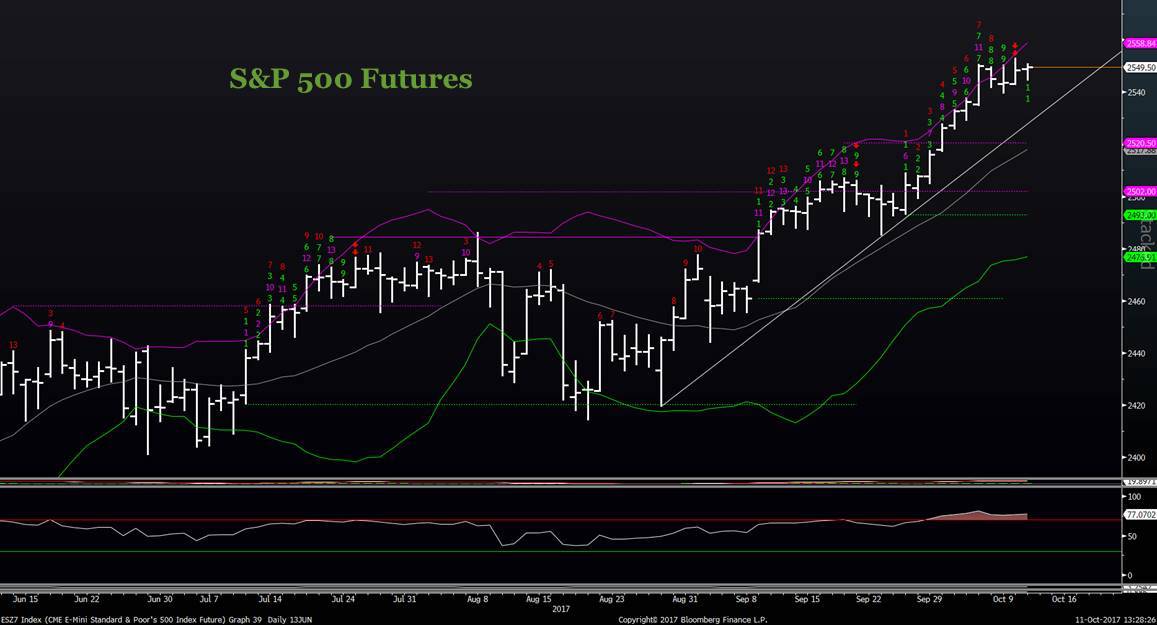
S&P 500 Futures Trading Update For October 19
Stock Market Trading Considerations For October 19, 2017
The S&P 500 (INDEXSP:.INX) and Nasdaq (INDEXNASDAQ:.IXIC) are trading lower this morning as sellers finally show up...
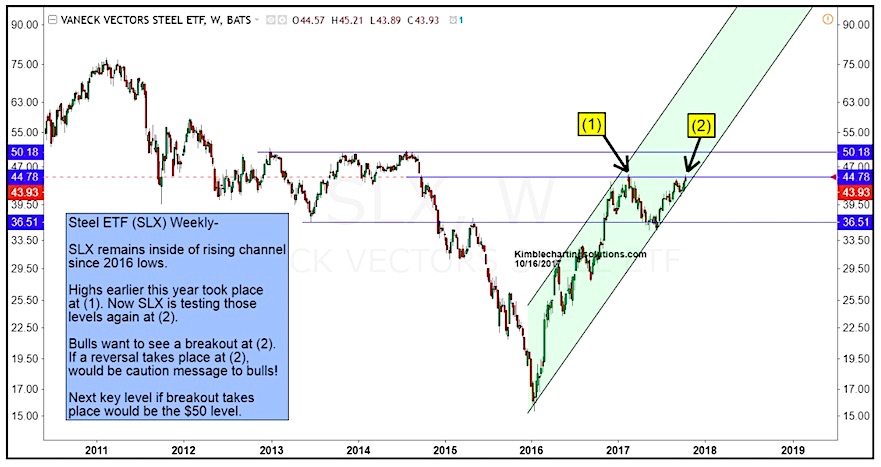
Is a Breakout Brewing for the VanEck Steel ETF (SLX)?
In the past few week's we've highlighted some assets and indicators that point to a stable/improving economy: Copper prices, firmer interest rates, etc. Time...
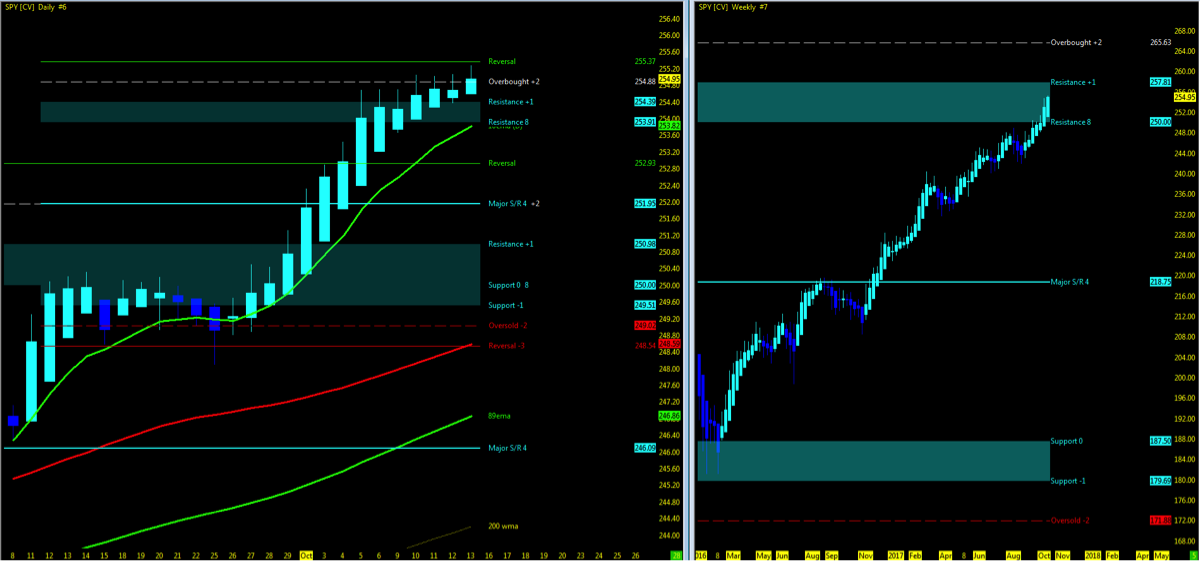
Stock Market Update & Weekly Trend Outlook – Week 42
THE BIG PICTURE
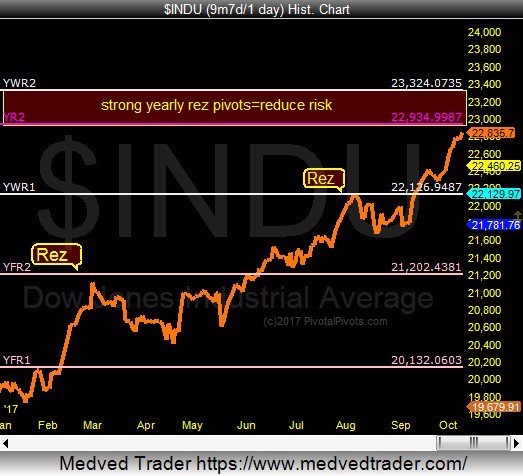
The major stock market indexes are in still moving higher and in strong uptrends. Although we are overdue for a pullback, the...
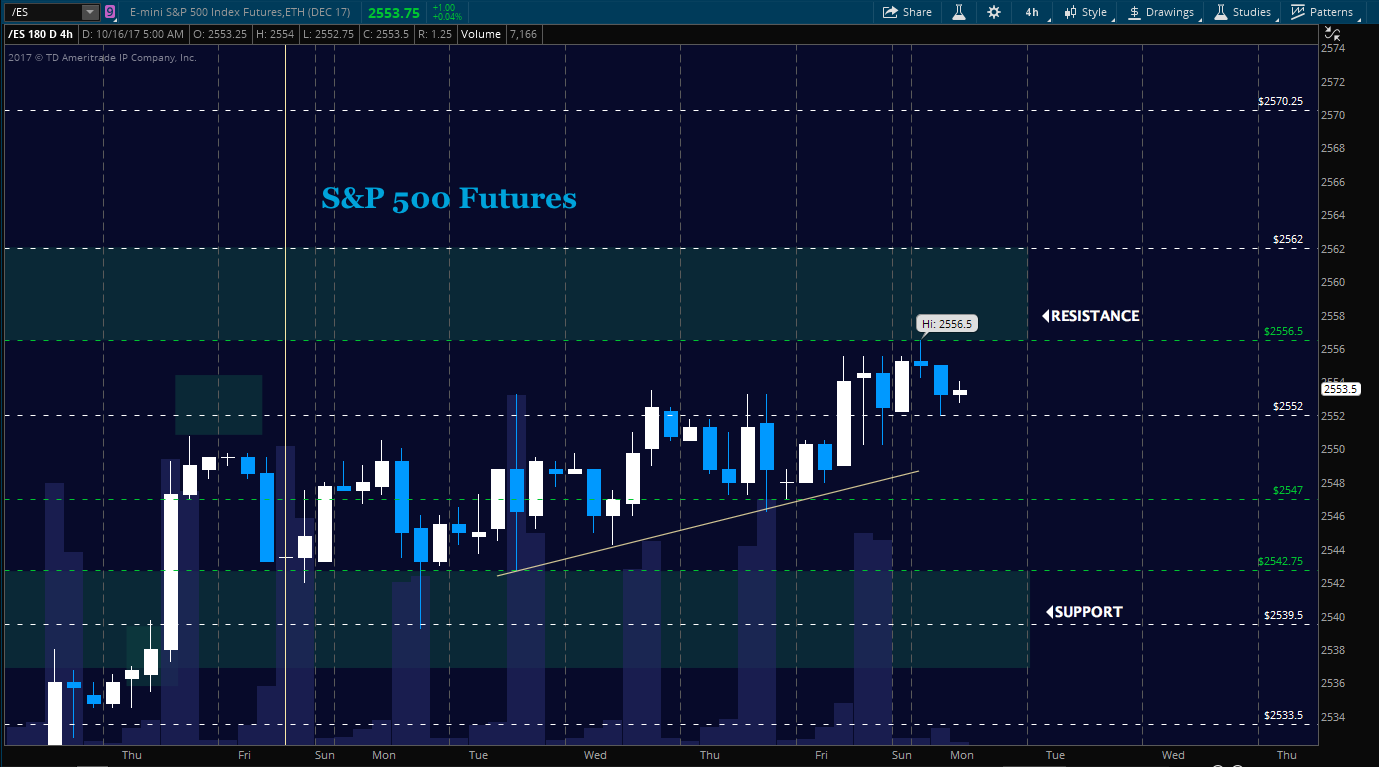
S&P 500 Futures Trading Outlook For October 16
Stock Market Trading Considerations For October 16, 2017
The grind higher continues to open the week, as the S&P 500 (INDEXSP:.INX) ticks up a few...
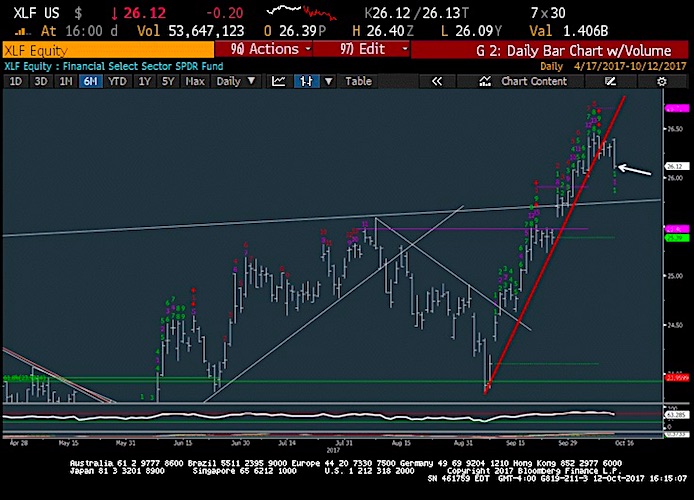
Chart Spotlight: Financial Sector ETF (XLF) Turns Lower
CHART SPOTLIGHT: The Financials Sector ETF - $XLF
The S&P Financials Sector ETF (NYSEARCA:XLF) took a further step down in a move which largely has...
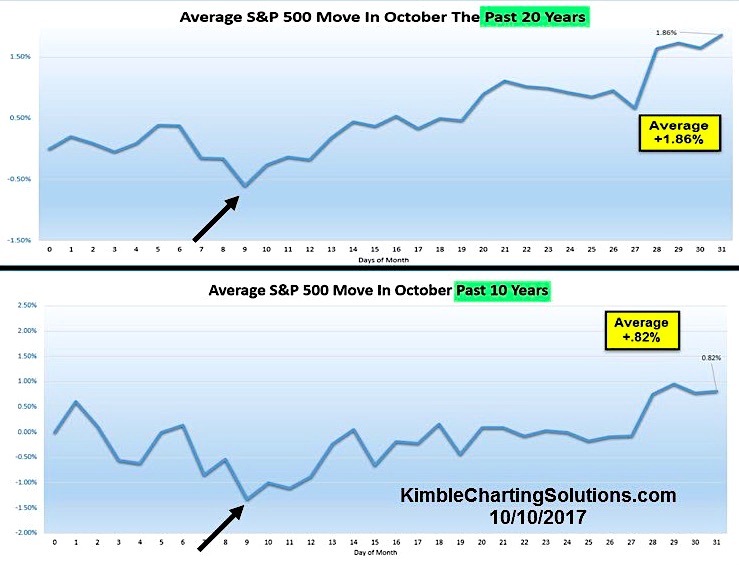
October Seasonality Underscores Recent Strength In Equities
A few days back I discussed October stock market seasonality in this blog post.
The point of that post was to show that a typical...
10 Years Later… Is The Stock Market Topping Again?
Happy 10-year anniversary? Or maybe not for investors...
It's been exactly 10 years since the S&P 500 Index (INDEXSP:.INX) recorded a major stock market top.
On October...
Stock Market Trading Update: Risks Rising For Bulls
S&P 500 Trading Outlook (2-3 Days): BEARISH
The S&P 500 (INDEXSP:.INX) has not yet shown sufficient signs that it should turn down. However, on a 3-5 day...
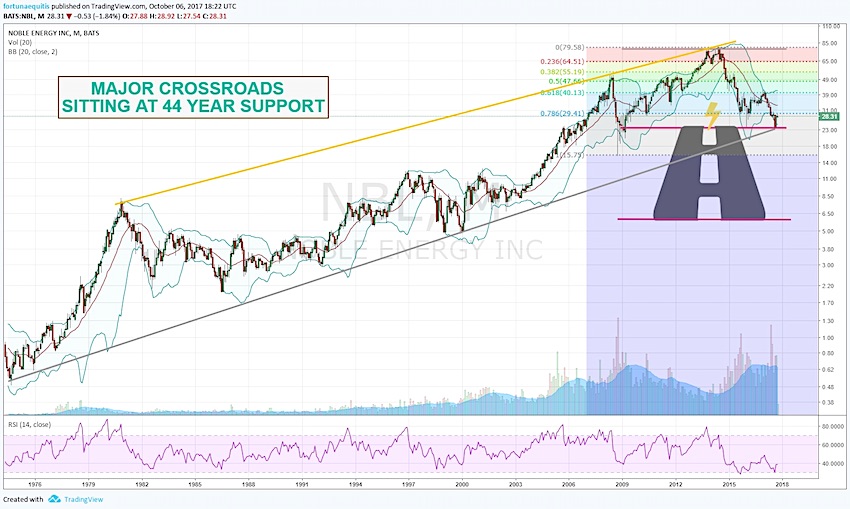
Noble Energy Stock (NBL): A Bull In Bears Clothing?
Noble Energy (NYSE:NBL) has a stock chart that got ugly within the Gas & Oil sector that has been very out of favor during...

