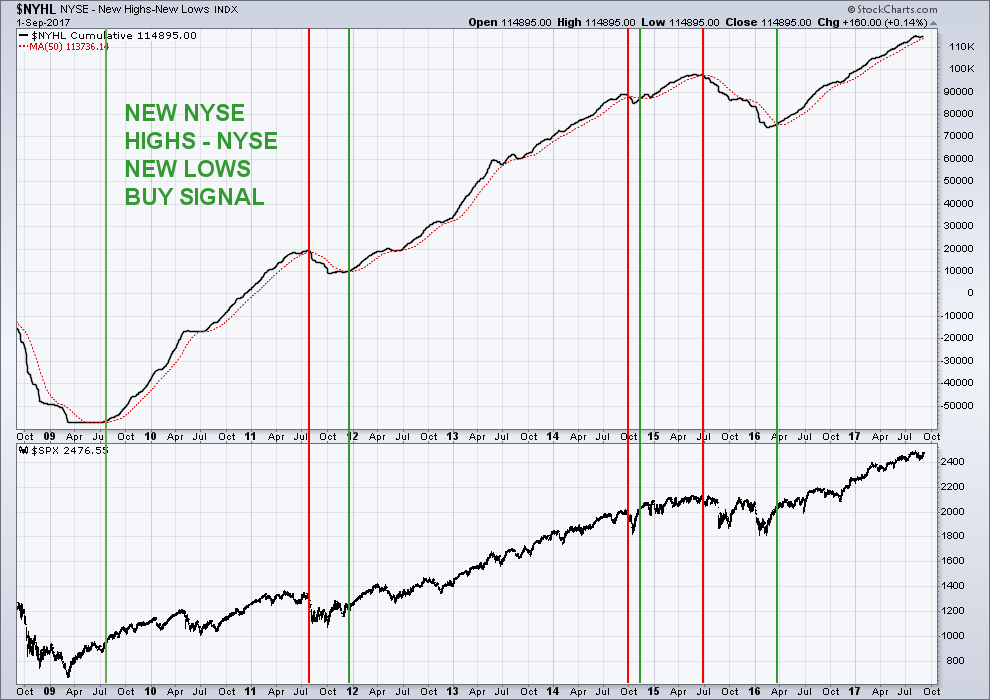
S&P 500 Outlook Into September: Breadth Remains A Pillar
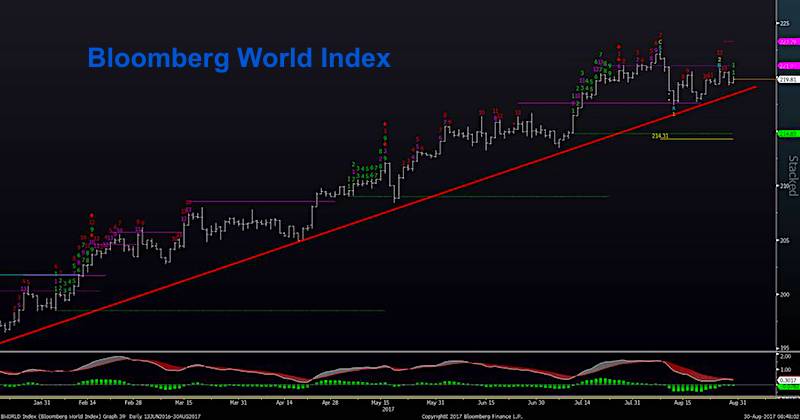
While some investors, and at least a handful of market analysts, obsess about a multitude of negatives or potential negatives, the average stock continues...
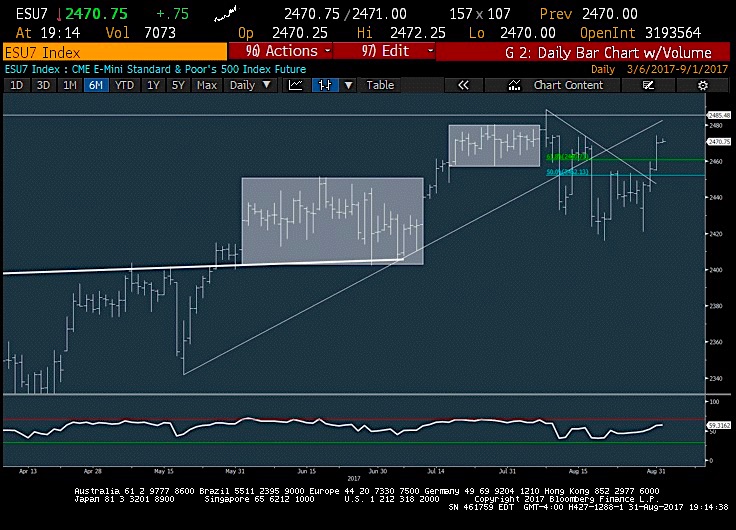
S&P 500 Trading Update: Bulls Eye Retest Of The Highs
S&P 500 Short-Term Outlook (2-3 Days): MILDLY BULLISH
The S&P 500 (INDEXSP:.INX) is getting a bit extended here and nearing key resistance as we start September....
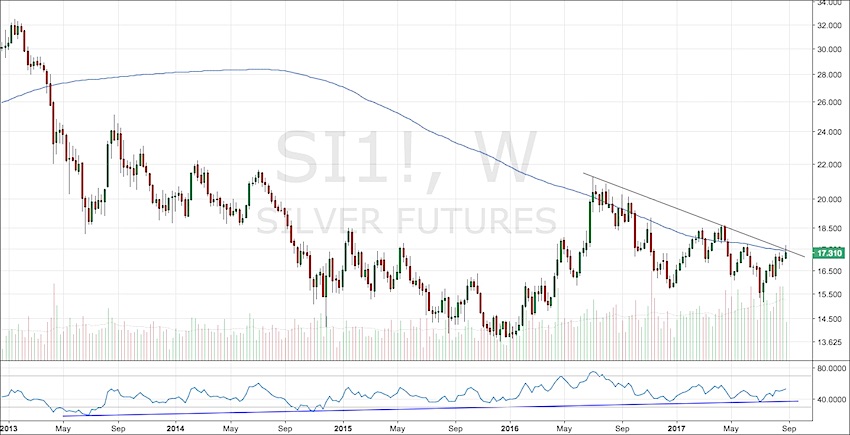
Is Silver Price Confirming Gold Sentiment?
Earlier this week market participants were exposed to some after hour fireworks - North Korea had launched a missile over Japan. As expected, gold...
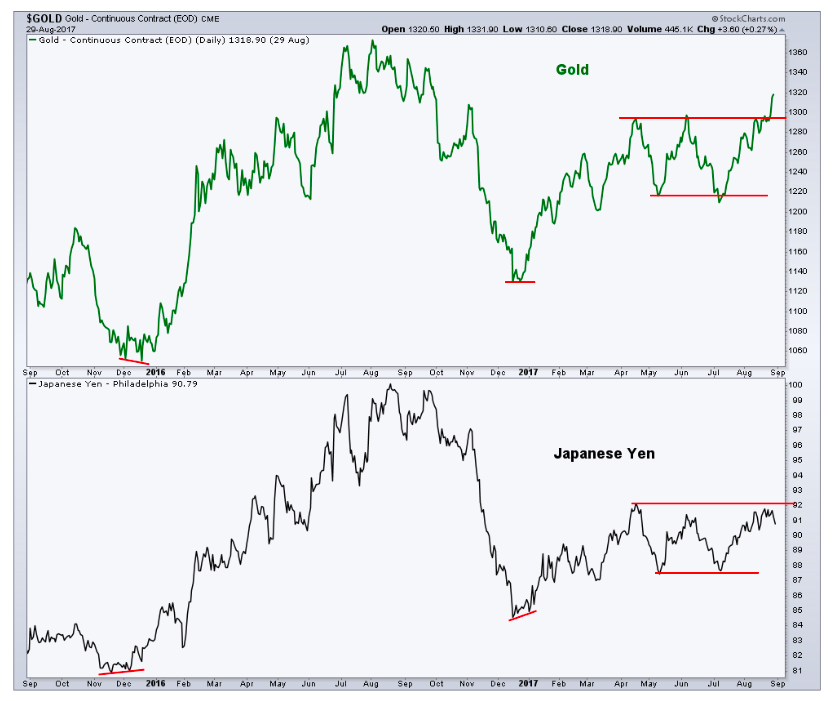
Is This Gold Breakout For Real: Watch The Japenese Yen!
There’s been a lot of discussion recently of the breakout in gold prices. The yellow metal had been trading in a range for the...
U.S. Equities Trading Update: Tech Sector Leads The Charge
We're seeing mild gains in the US and European equity markets following two key US economic reports: ADP data coming in 237k and GDP...
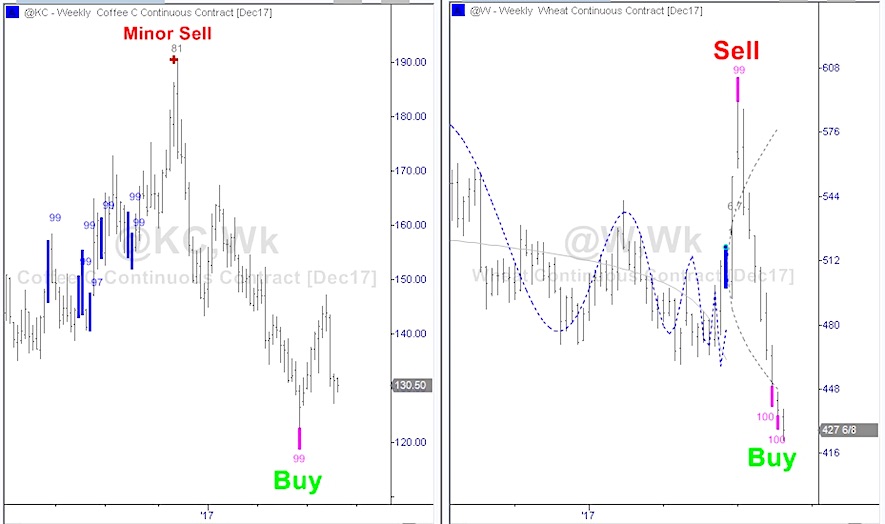
The Breakfast Trade: Buy Signals For Coffee And Wheat
Trading volatile commodity markets can be quite challenging, but at Market Inflections we employ a software application which helps to identify when trends are...
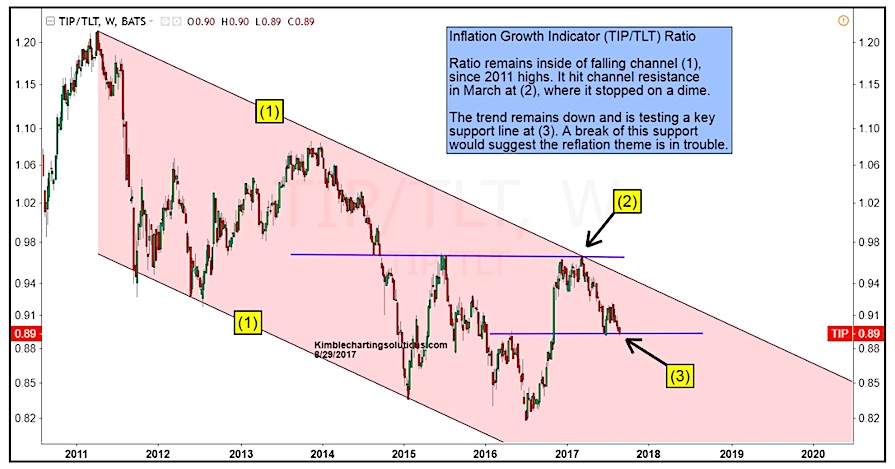
Key Inflation Gauge Testing Merits Of Reflation Theme
Back in June, we took a look at a key inflation gauge and pointed out why the reflation theme wasn't quite ready for primetime just...
S&P 500 Futures Trading Outlook For August 30
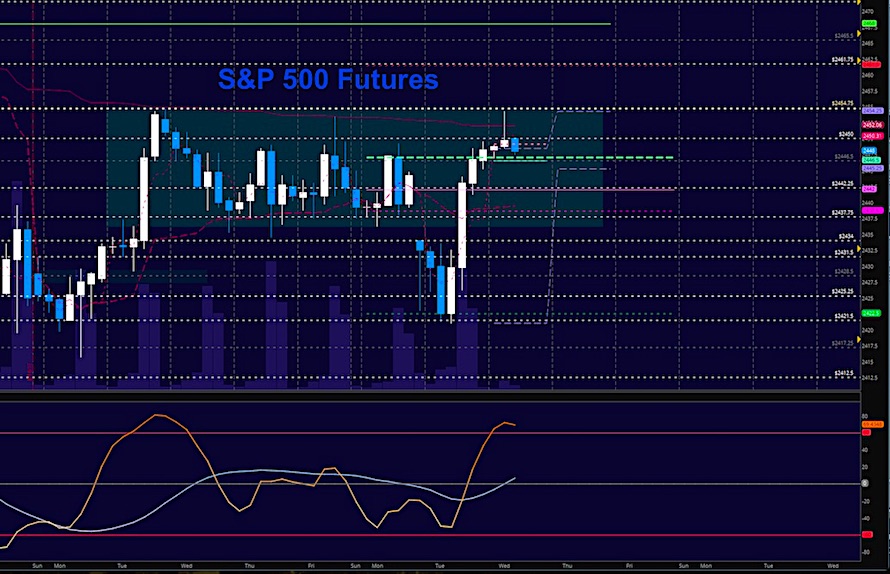
Stock Market Futures Trading Considerations For August 30, 2017
The S&P 500 Index (INDEXSP:.INX) is looking to build on yesterday's reversal to the upside. Traders...
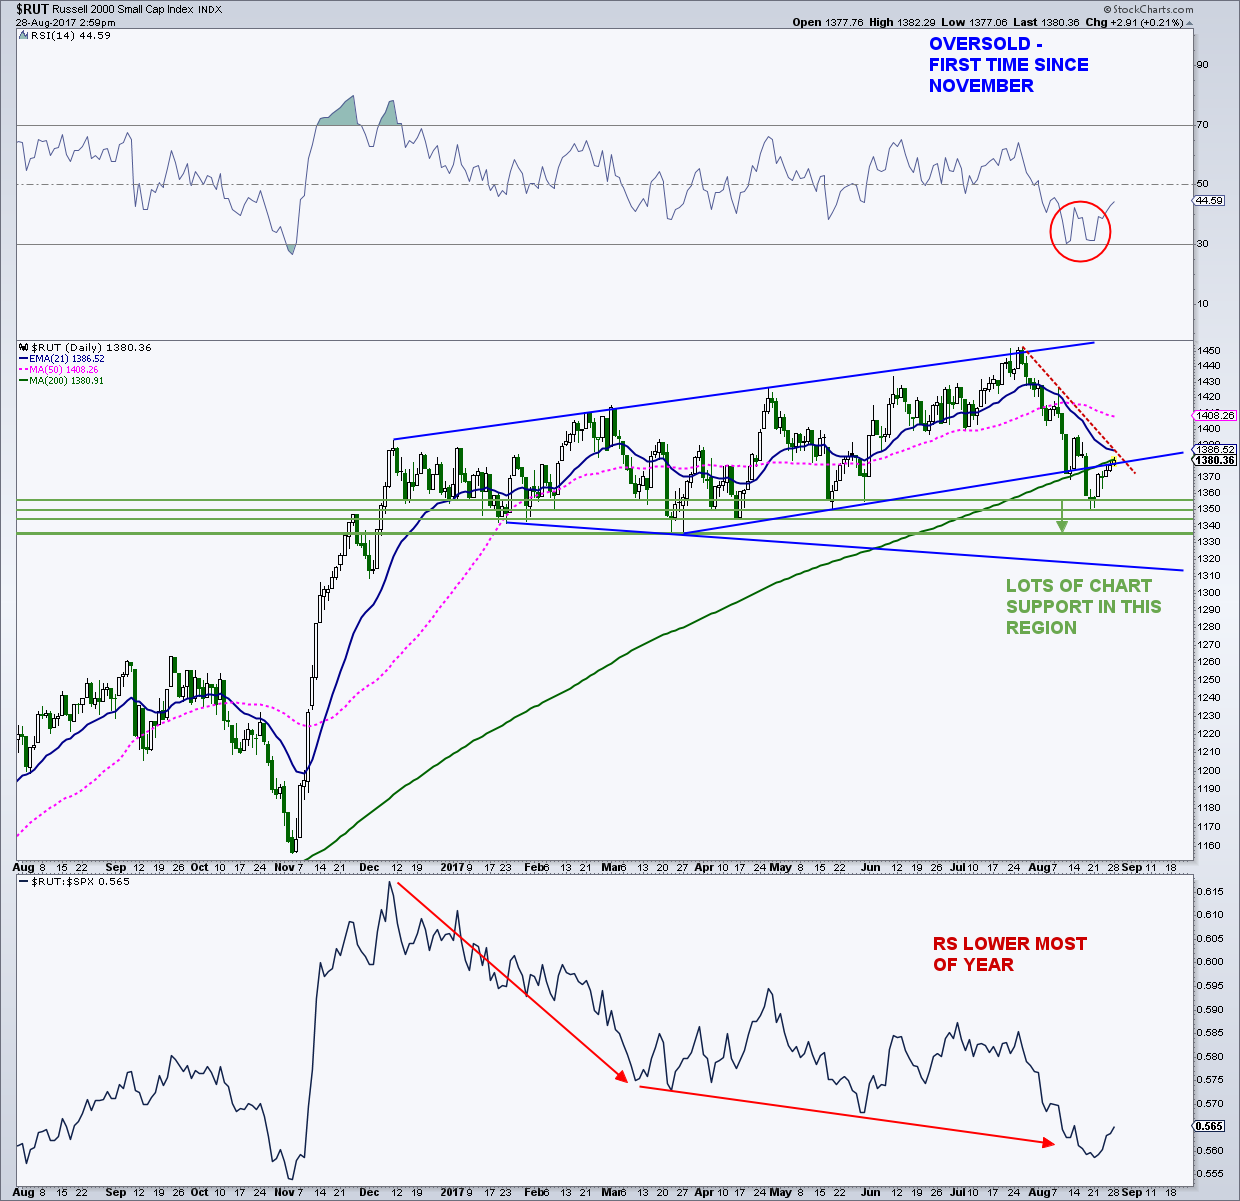
Inside The Russell 2000 Decline: Does The Bounce Have Legs?
The Russell 2000 Index (INDEXRUSSELL:RUT) has quietly put together a multi-day winning streak. This all sounds well and good, but this follows a multi-week...
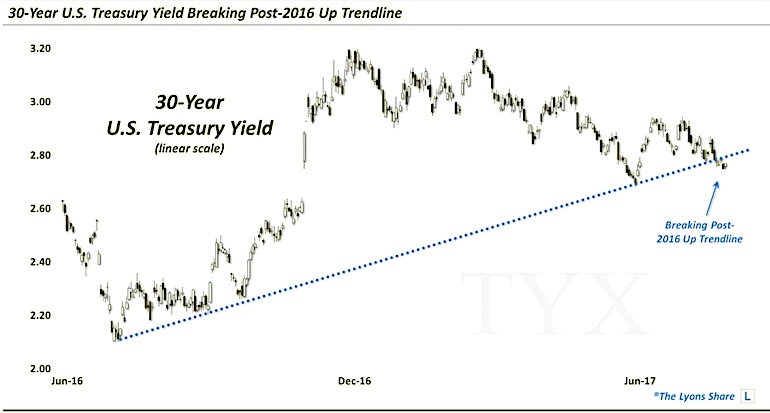
Chart Spotlight: U.S. Treasury Yields Under Pressure
As many of you know, I like to share charts that on trend lines. Whether price is testing, retesting, breaking out, or breaking down...

