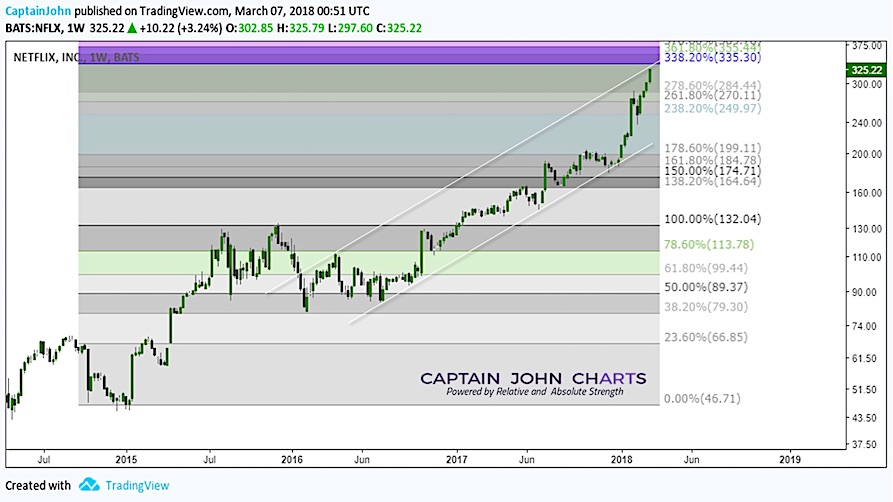
Netflix (NFLX) Stock Chart: Bullish Long Term But Careful Here
As a fellow momentum stock and FANG member Netflix (NFLX) has seen some huge gains in 2018.
Cyclical stocks have outperformed, with tech being a...
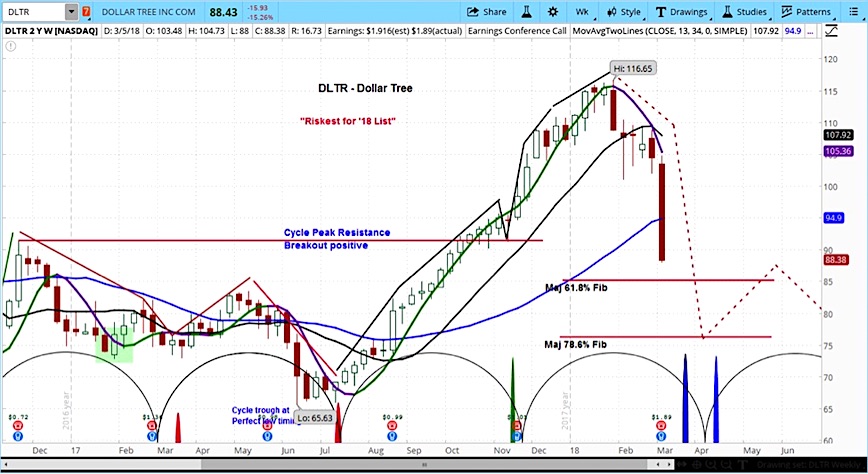
Dollar Tree Shaken By Earnings, Cycles Point To Further Risk
Dollar Tree (DLTR) lost some of its green leaves this morning, with the stock falling by 16% on less than enthusiastic earnings results.
The company...
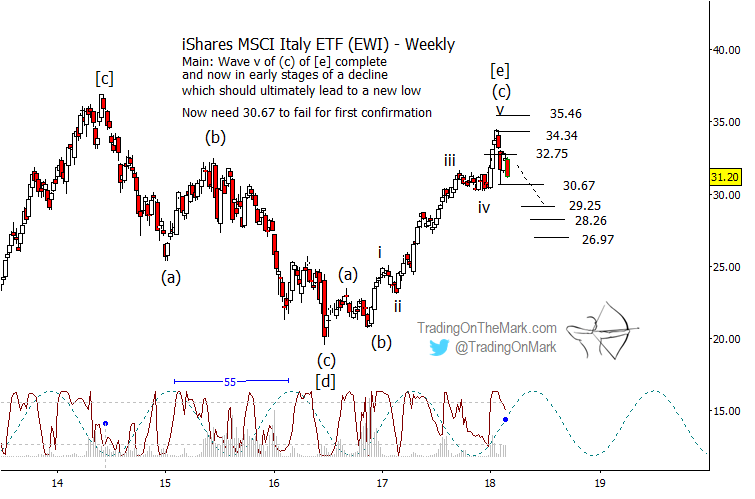
Italy ETF (EWI) Enters Corrective Phase Of Elliott Wave Pattern
The consolidation pattern we have been monitoring in Italian stocks appears ready to swing into its next phase. Readers might recall our post in...
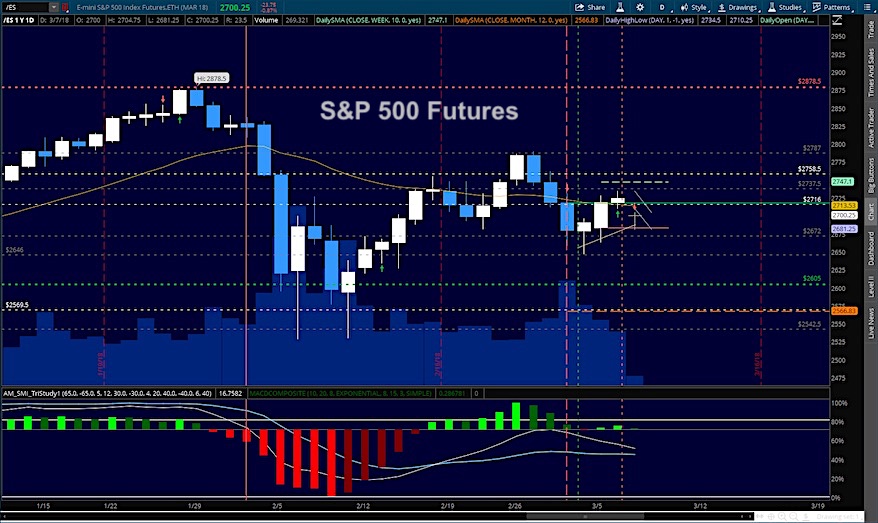
Stock Market Futures Trading Update: Bulls Look To Recover Losses
Broad Stock Market Outlook for March 7, 2018
The news about Gary Cohn leaving the Trump administration sent markets gapping down after hours. However, since that...
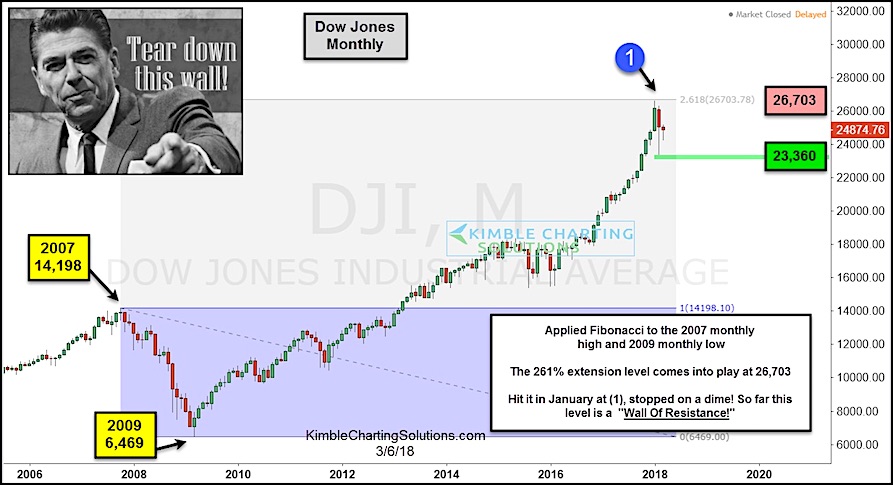
Bulls May Have Trouble Tearing Down This Wall Of Resistance!
Don't believe in the power of Fibonacci price levels?
Perhaps this two-pack of stock market charts will change your mind.
Back in late December, I warned...
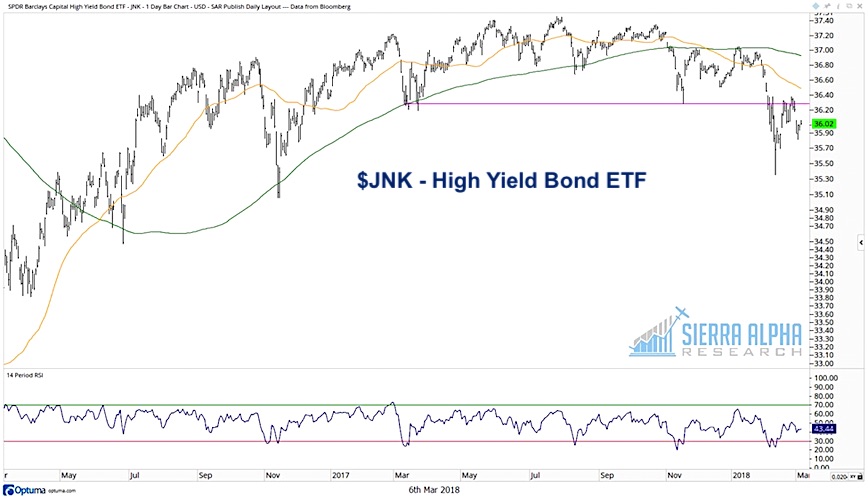
Slippery Signs Coming from the Junk Bond Market
High yield bonds can often serve as a leading indicator for the equity markets. And although indexes which track high yield returns have not...
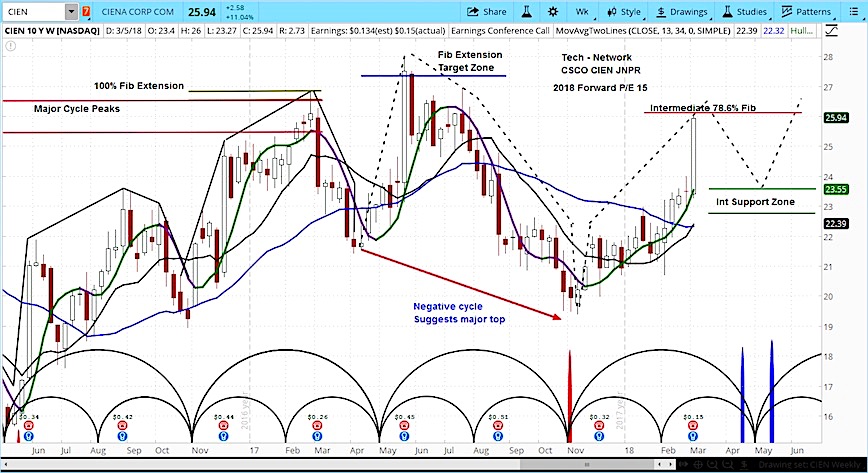
Ciena Pops On Strong Earnings, Wait For Buying Opportunity
Ciena Corporation (CIEN) shot up 12% on Monday morning on strong earnings.
Ciena reported adjusted earnings per share of $0.15 and total revenue of $646...
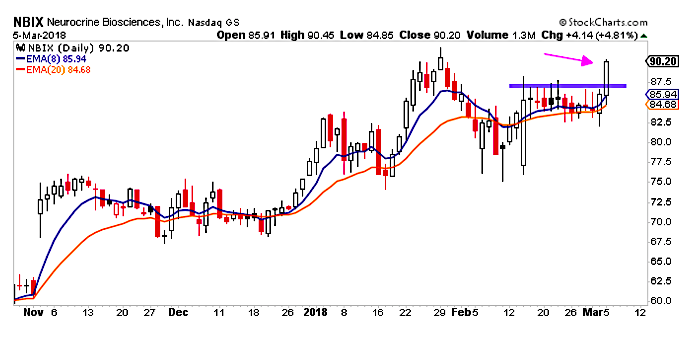
5 Stocks With Bullish Trading Setups This Week
Stocks finished strongly positive on the day after starting off in the red with a lower gap open.
This was a bullish follow-through day after...
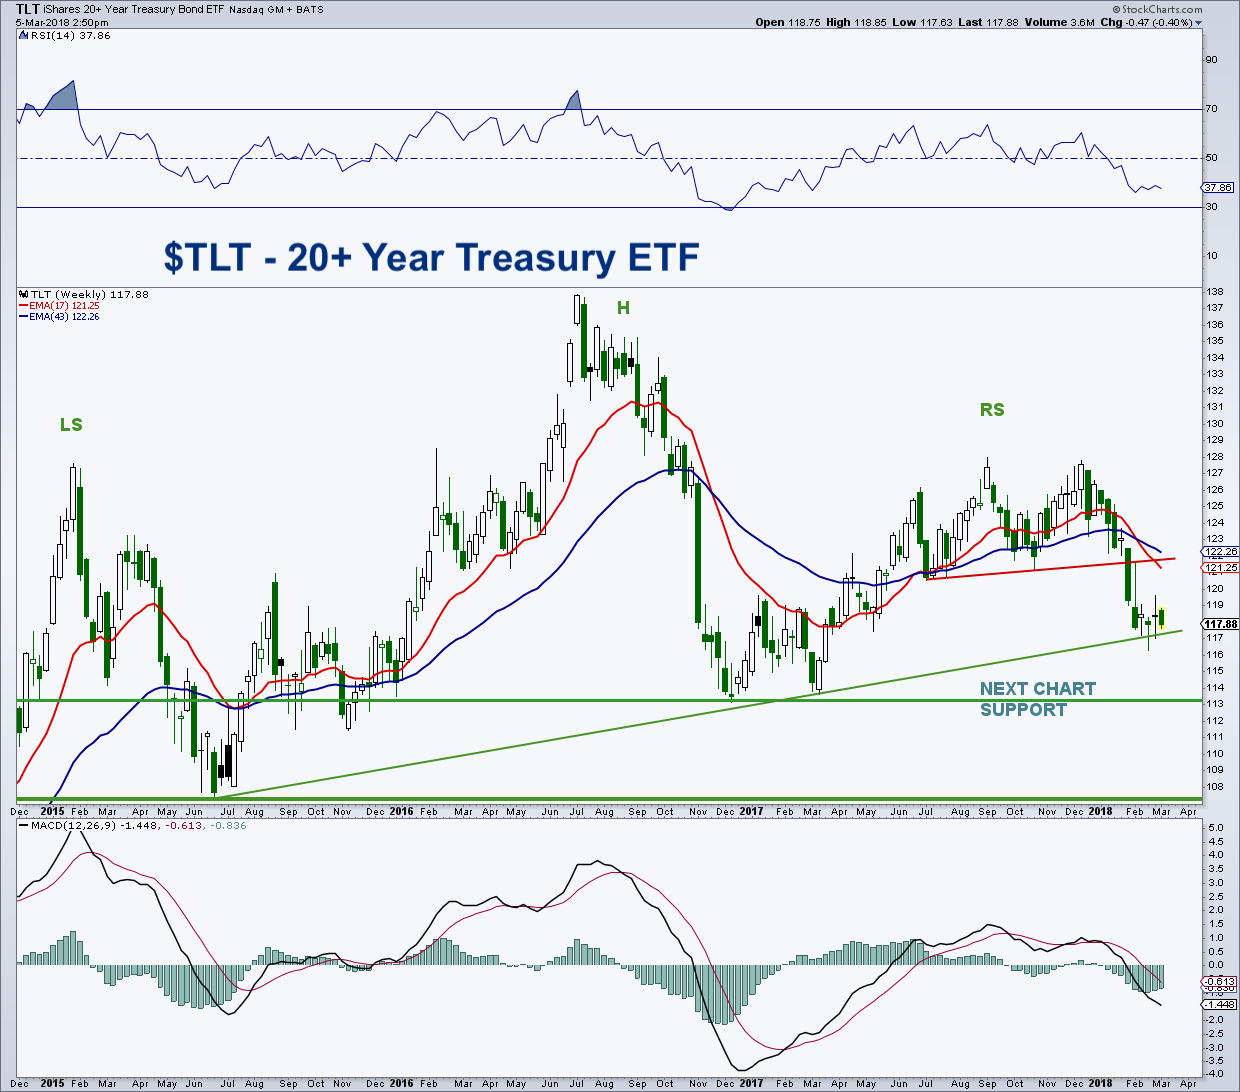
Treasury Bonds ETF (TLT): Near-Term Bounce, Long-Term Top?
Treasury bonds have gotten out of favor as investors continue to price in rising interest rates. This has the Treasury Bonds ETF (TLT) testing key...
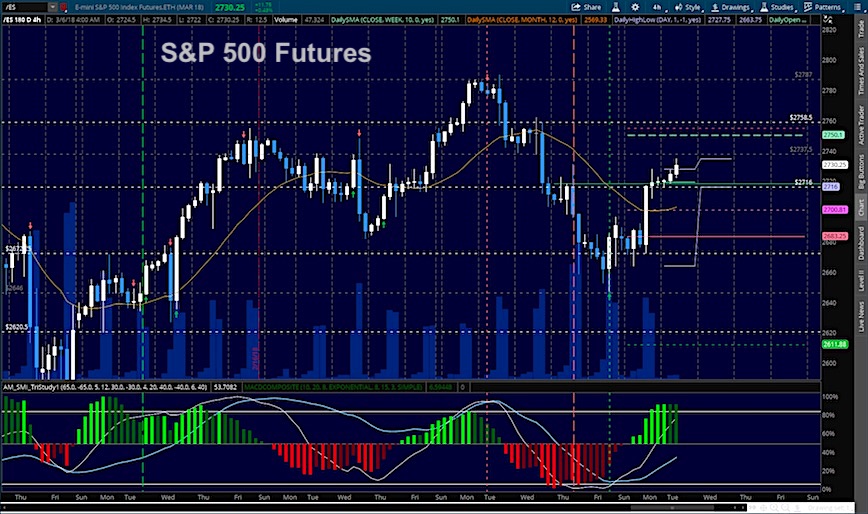
S&P 500 Futures Trading Update & Near-Term Price Targets
Broad Stock Market Outlook for March 6, 2018
Bounces continue across all the indices this morning and higher lows form as a potential right shoulder builds...

