Mid-Week Stock Market Outlook: Pullback Within An Up-Trend
The S&P 500 (SPY) finished lower by 0.61% and continues to have a strongly bullish intermediate posture according to the Market Forecast indicator.
All major...
Stock Market Today: Can Bulls Hold Recent Gains?
U.S. equities battled back from early losses Monday to close mixed on the session.
The 4 major stock market indexes ended slightly up or...
After a Long Winter Rally, Hammy the Pig Gets His Spring Bath
How many can say they have been kissed by a pig?
Hammy and I started our love affair in February when he became our mascot...
U.S. Corn Futures Market Outlook: China-US Trade Talks In Focus
Corn futures closed up 6 cents last week, finishing at 3.63 on Friday.
What is causing the depressed prices in corn futures and will it...
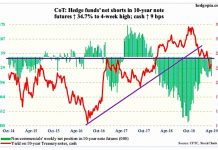
COT Report: Bond Yields Bottom… or Just a Bounce?
The chart and analysis below looks at non-commercial futures trading positions for the 10 Year US Treasury Note and yield.
For the week, the cash 10 Year...
What Does 2019’s Hot Start Mean for Stocks This Year?
The S&P 500 index has gotten off to a hot start in 2019, so I decided to dive in and see just how hot...
Stock Market Futures Update: Support Levels In Play
Stock market futures are lower this morning, with the S&P 500 (SPX) off 5-10 points.
Stocks are attempting to hold higher supports. Higher lows need to...
Stock Market Today: High-Beta Outperforming, Small Caps at Resistance
It's been a very strong start to 2019 for the major stock market indexes.
The first quarter posted big gains, and the second quarter is...
S&P 500 Forecast: Stock Market Cycles Enter Declining Phase
The S&P 500 (SPX) rose 58 points last week to 2892, an increase of 2%.
Trade optimism returned last week, amidst improved sentiment in China,...
S&P 500 Fibonacci Price Analysis and Forecast for 2019
Since our original post in late December when the S&P 500 was the Fibonacci support price level of 2375.51, the index is up nearly...


