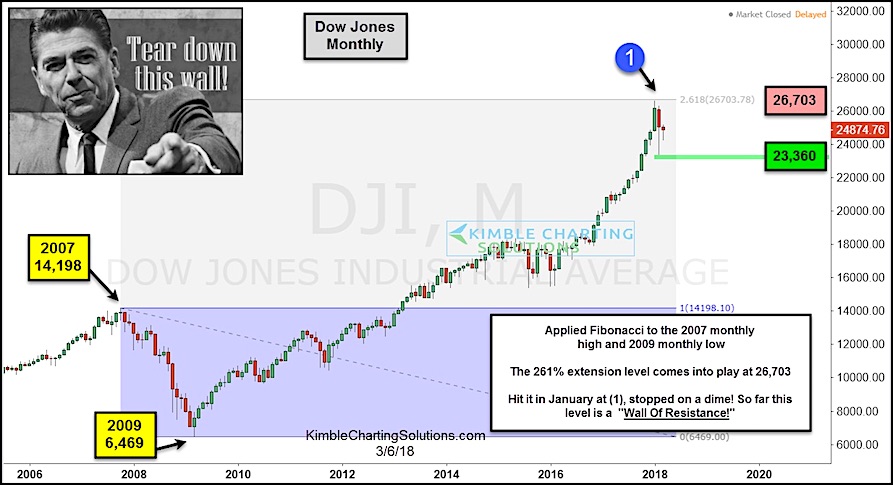
Bulls May Have Trouble Tearing Down This Wall Of Resistance!
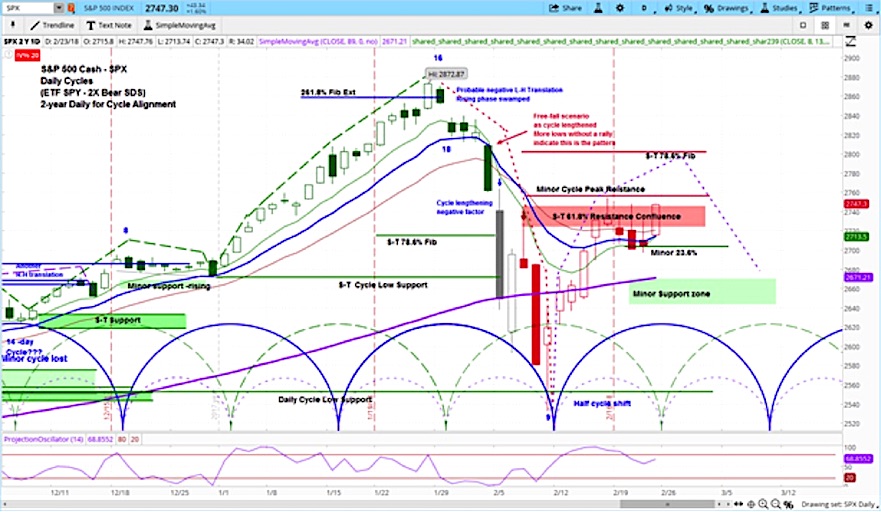
Don't believe in the power of Fibonacci price levels?
Perhaps this two-pack of stock market charts will change your mind.
Back in late December, I warned...
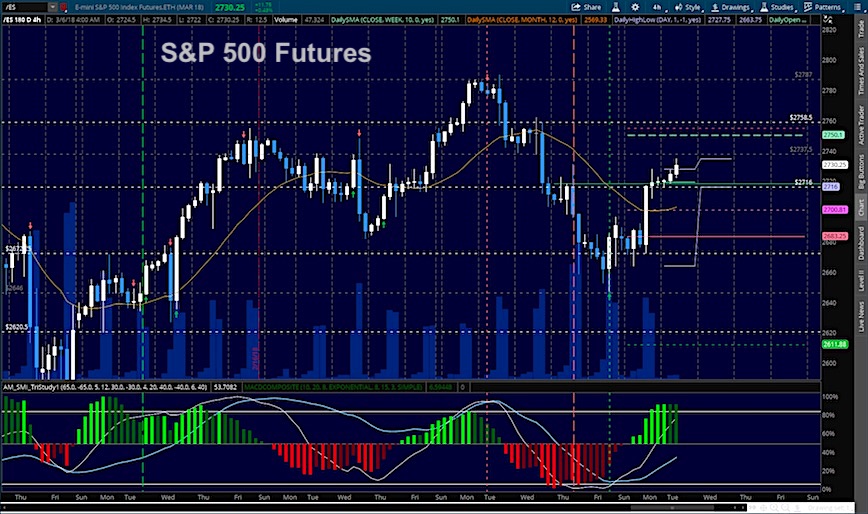
S&P 500 Futures Trading Update & Near-Term Price Targets
Broad Stock Market Outlook for March 6, 2018
Bounces continue across all the indices this morning and higher lows form as a potential right shoulder builds...
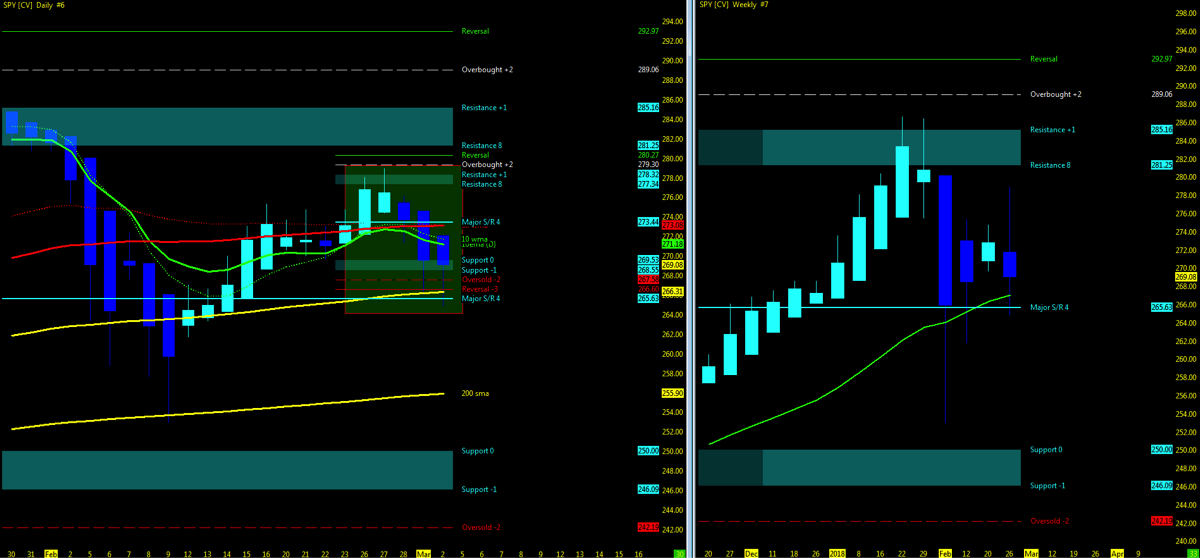
Stock Market Trends Update & Outlook (Week 10)
THE BIG PICTURE
Investors are operating in a volatile stock market climate so it pays to be disciplined while remaining in trend within your given...
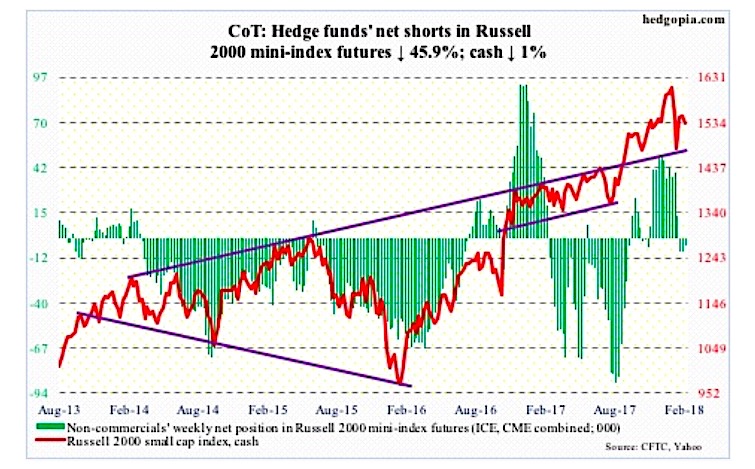
COT Report: Russell 2000 Is Toeing The Line(s)
The following chart and data highlight non-commercial commodity futures trading positions as of February 27, 2017.
This data was released with the March 2 COT...
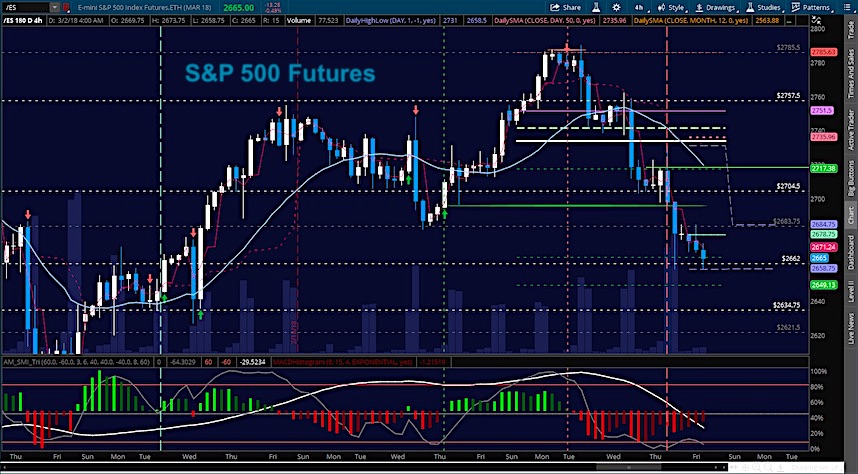
Stock Market Futures Trading Outlook: Under Pressure
Broad Stock Market Outlook for March 2, 2018
Deeper tests continue across the board as momentum weighs heavy with sellers forcing prices down across the indices.
Today...
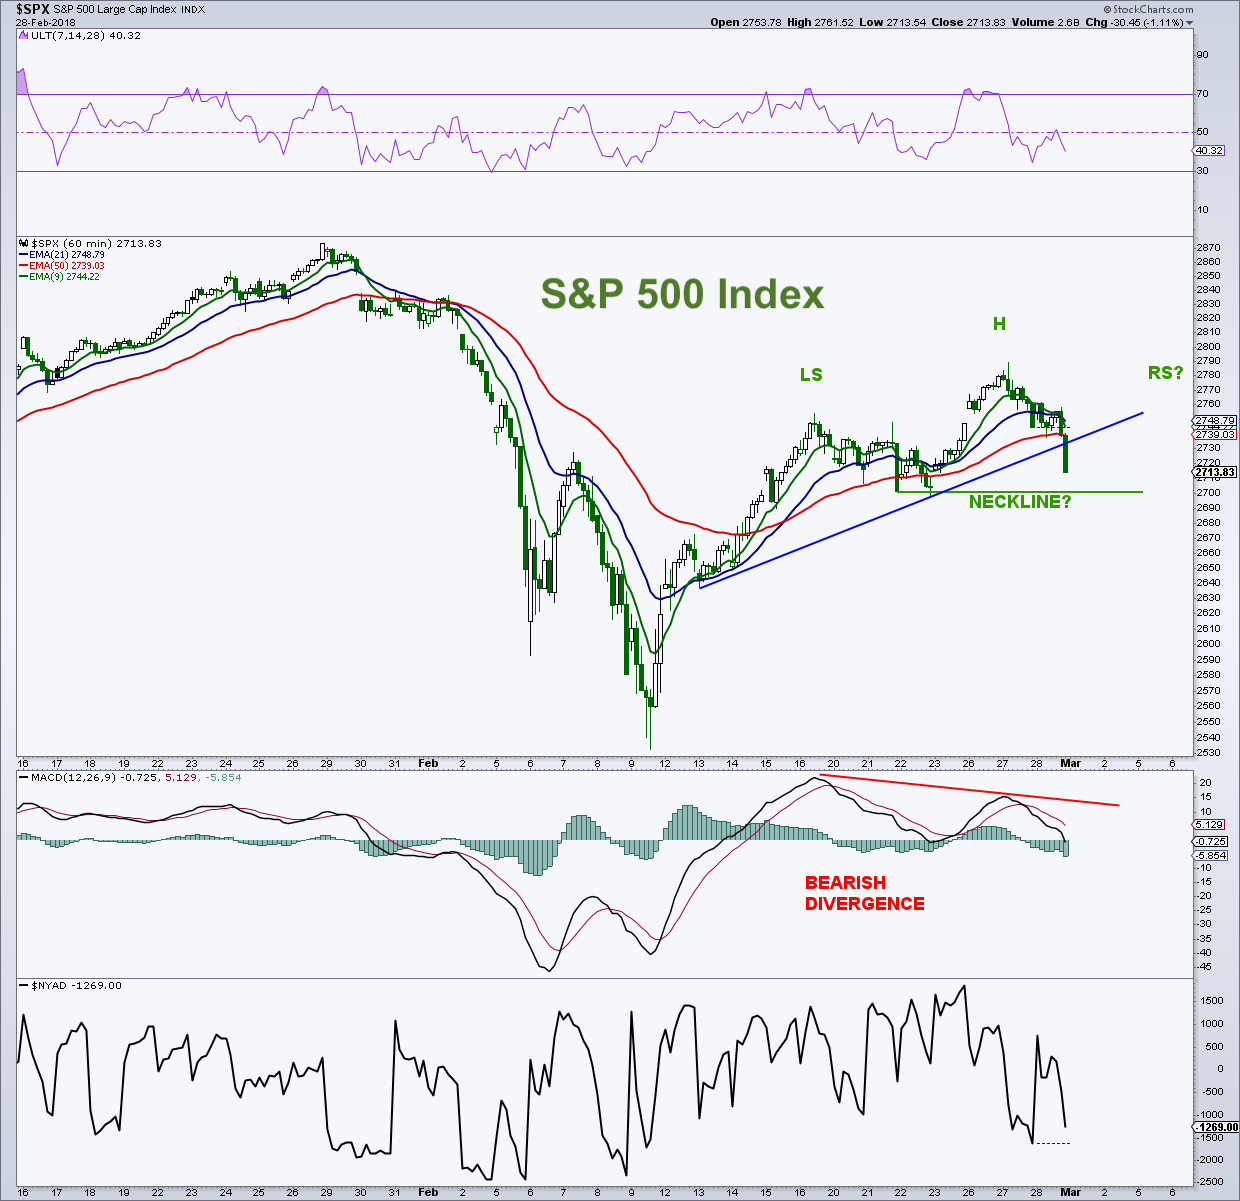
S&P 500 Chart Update: Bull-Bear Battle At 2700
The S&P 500 has seen a fair amount of bearish days of late.
And although the damage isn't extensive, today's reversal lower caught my attention.
S&P...
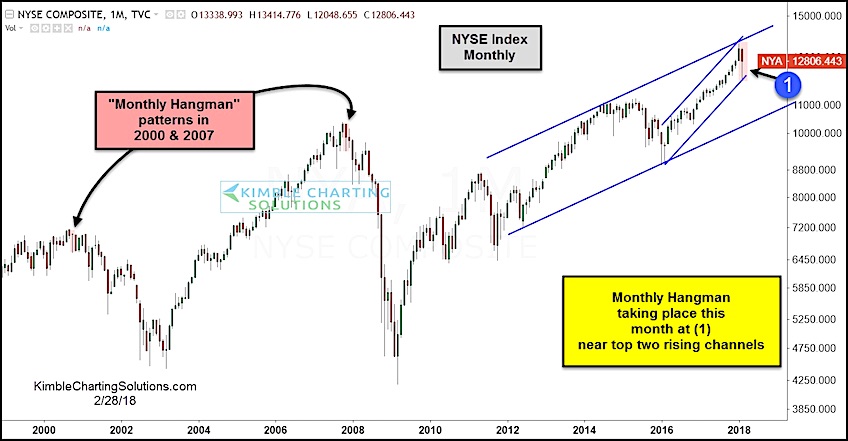
Will Historic Opportunity For Bears Lead To A Bull Market Sunset?
The first two months of 2018 are in the books and it is safe to say that the stock market has been a tale...
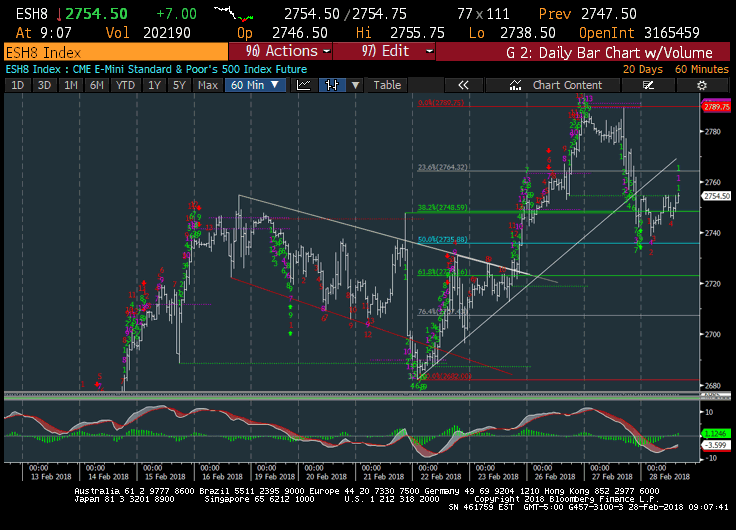
S&P 500 Near-Term Trading Outlook: Interest Rate Watch!
S&P 500 Trading Outlook (2-3 Days): Bearish
Pullbacks are likely limited to the next 2-3 days before the rally continues.
I expect yesterday's decline might lead to...
Equity Markets Show Their Hand: Growth Over Income
GROWTH IN ISOLATION
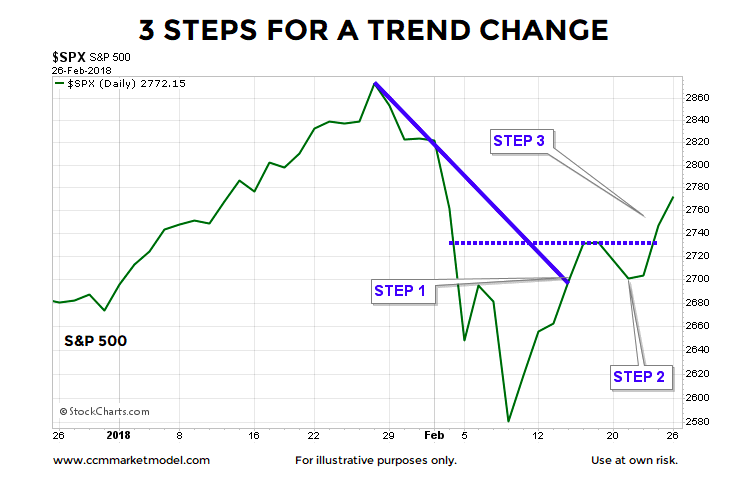
A July 2013 See-It-Market post outlined the three steps required for a trend change.
The S&P 500 recently broke the downward-sloping trend line below (step...
Market Outlook: Stocks Set To Continue Bounce, Then Fail
The S&P 500 reversed course on Friday and rallied back to new 3-week closing highs.
Look for stocks to extend gains into this week before...

