Let the Economic Modern Family Be Your Investing Guide
After the Fed announcement that they will be buying corporate bonds, the market took off.
Like mentioned in the weekend Daily, we must go back...
Stock Market Today: Increase In COVID-19 Cases Rattles Investors
As we begin the new week, stock market futures are lower and an increase in volatility looks likely.
Investor concerns appear focused on the increase...
2020 Providing Plenty of Volatility but Little Progress
Key Stock Market Takeaways:
- Knowing the ride keeps investors leaning in the right direction
- Consolidation could provide breadth leadership and renewed skepticism
- Copper suggest...
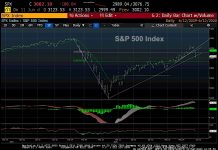
S&P 500 Index Trading Outlook: Will Sharp Decline Find Buyers?
S&P 500 Index INDEXSP: .INX Trading Chart
S&P 500 Trading Outlook (3-5 Days): Looks right to buy into Thursday's weak close for early strength on Friday, but Support...
The Federal Reserve’s Monetary “Animal House”
“…seven years of college down the drain.” – John “Bluto” Blutarsky, Animal House
The inspiration and credit for this article belongs to Emil Kalinowski and...
Stock Market Today: Breadth Metrics Flash Near-Term Warning
Stocks turned mixed on Wednesday as indices outside the Nasdaq continued to tread water.
This, coupled with near-term breadth metrics may be sending a warning...
Stock Market Outlook: Will Nasdaq Stall At 10,000?
The S&P 500 Index shows a strong bullish intermediate posture with a bullish short-term pattern on its Market Forecast study.
The two-day weakness hasn’t...
Investor Complacency Has Consequences
When stocks trend higher, investors enjoy the spoils.
Especially toward the end of the trend (on any timeframe). And it becomes easier to notice the...
The Vanna White Economic Recovery
Listening to economists and the financial media forecast the road to economic recovery has begun to sound a little like a game of Wheel...
S&P 500 Index Nears Important Monthly Closing Inflection Level
S&P 500 Index "monthly" Chart
The stock market rally has taken the S&P 500 Index all the way back to an important price point on...


