Gold / US Dollar Attempting Historic Bullish Breakout!
I have spent a lot of time discussing the bullish implications of Gold price patterns and the recent Gold breakout attempt.
So why not offer...
U.S. Equities Market Update: A Pause To Refresh?
This week's update is going to be a short one. Quite frankly, not a lot has changed technically for the major stock market indices.
That...
Stock Market Warning Signs Flash In Early April
Last week, we covered the weekly charts on the "Economic Modern Family" (our favorite stock market ETFs) and why watching the one index and...
Treasury Bond Yields: Breakout May Test 5% Again
Many investors seem to think that inflation is under control and interest rates are set to decline.
While this may be the longer term play,...
Is the S&P 500 Flashing a Spring Sell Signal?
The stock market has been red hot over the past 5 months or so with both the S&P 500 and Nasdaq sporting big gains.
But...
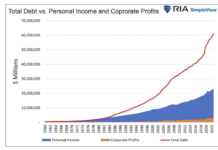
Japans Lost Decades: Is U.S. On The Same Path?
Back in 1989, Japan was taking over the world. The country’s economy had grown 6.7% in 1988. Sony had just bought Columbia Pictures, one...
Can Bitcoin Rally Hold Above Key Fibonacci Level?
Bitcoin has struggle to overcome a very important price level for more than two years: the 1.618 Fibonacci extension level.
This price area is especially...
Shanghai Stock Exchange Composite At Long-Term Crossroads!
When the Chinese economy or stock markets are signaling an important turn or good/bad signal, the rest of the world needs to listen.
Today, we...
10 Year Bond Yield Testing Key Resistance This Month!
The 10-year treasury bond yield is very closely watched by banks, consumers, and active investors. It is used as a measuring stick for interest...
Nasdaq 100 Trades At Short-Term Top Price Target
The Nasdaq 100 has traded in a steady up-trend for several weeks, leading the broader stock market higher.
But perhaps this red-hot index has gotten...


