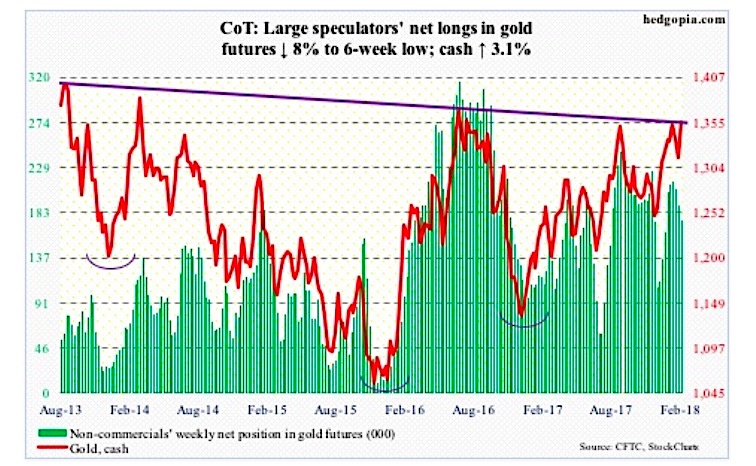
Patient GOLD Bulls Continue to Wait for a Breakout
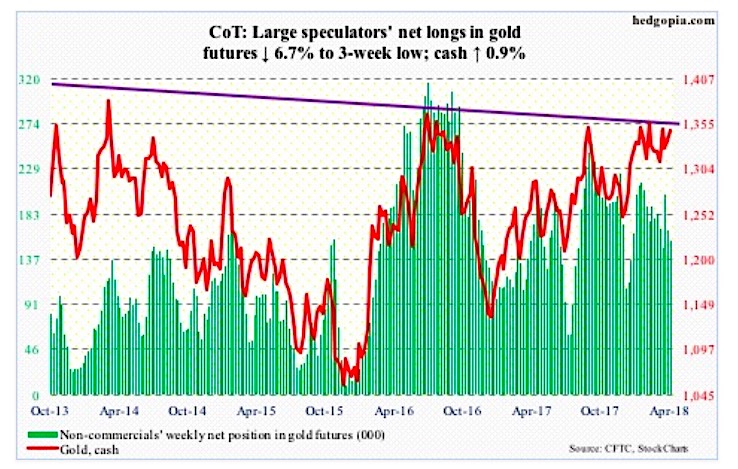
The following chart and data highlight non-commercial commodity futures trading positions as of April 10, 2017.
This data was released with the April 13 COT...
Gold Is Knocking… Will Metals Bulls Answer?
Is gold ready for primetime?
The shiny metal is testing the $1360-$1370 level for the fourth time this year.
One factor that has helped to keep...
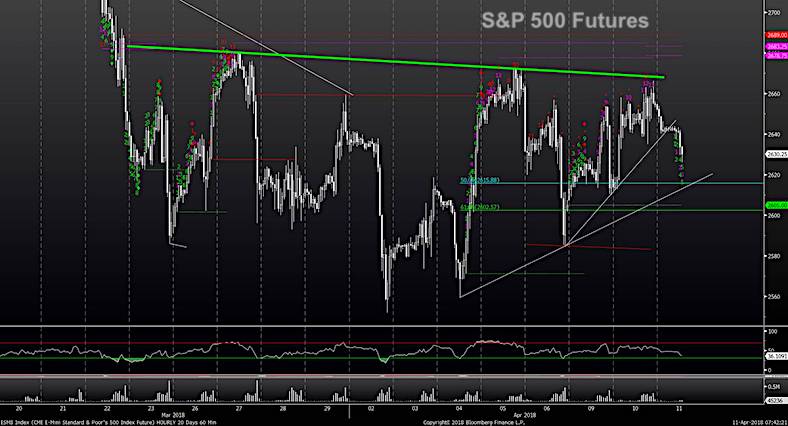
S&P 500 Market Outlook: Gold Shines, Stocks Holding On
Key Developments In The Financial Markets
Stocks continue to consolidate. And Gold tests key breakout level.
Tuesday's stock market rally helped to add some conviction to...
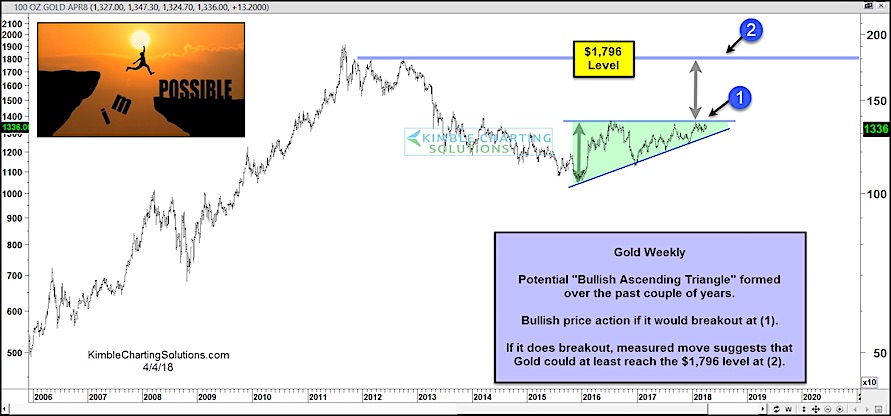
A Breakout Here Could Produce Another Gold Rush
Gold prices have chopped higher since bottoming in December 2015.
The move has not been as exciting as precious metals bulls would like but its...
Gold Trading Update: Bullish Action Continues
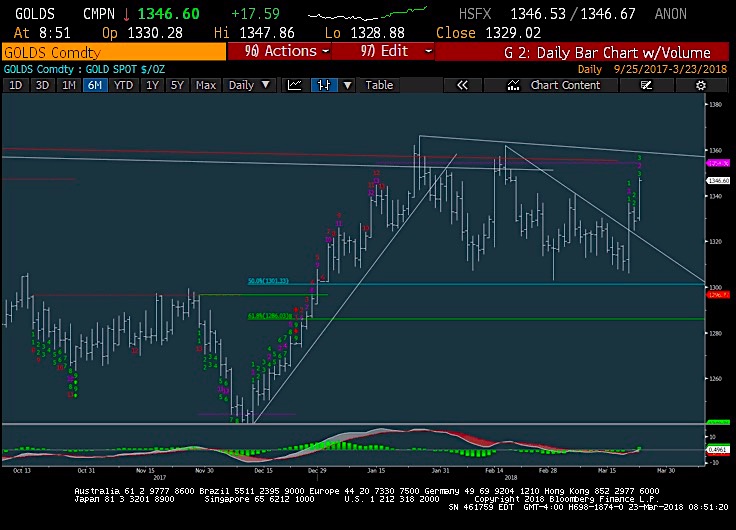
Gold Trading Outlook: Near-Term Bullish
Gold and Silver are moving above key trend lines and look poised here.
Looking at Gold specifically, it looks ready to...
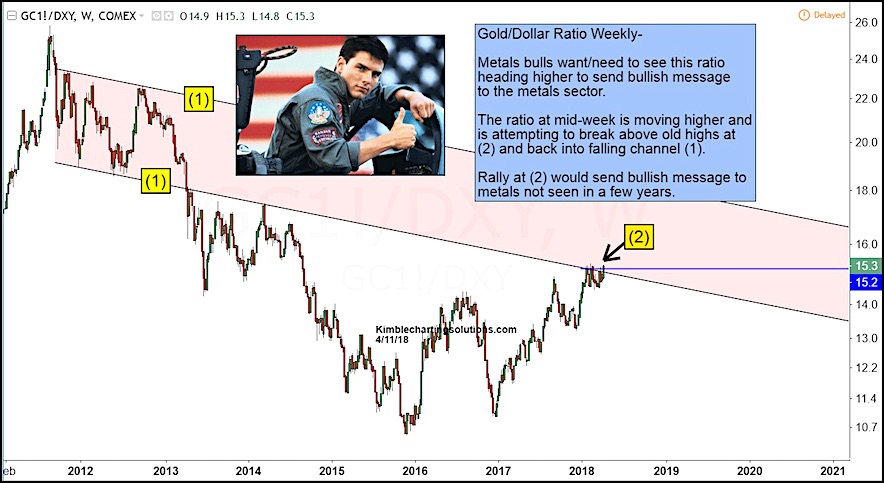
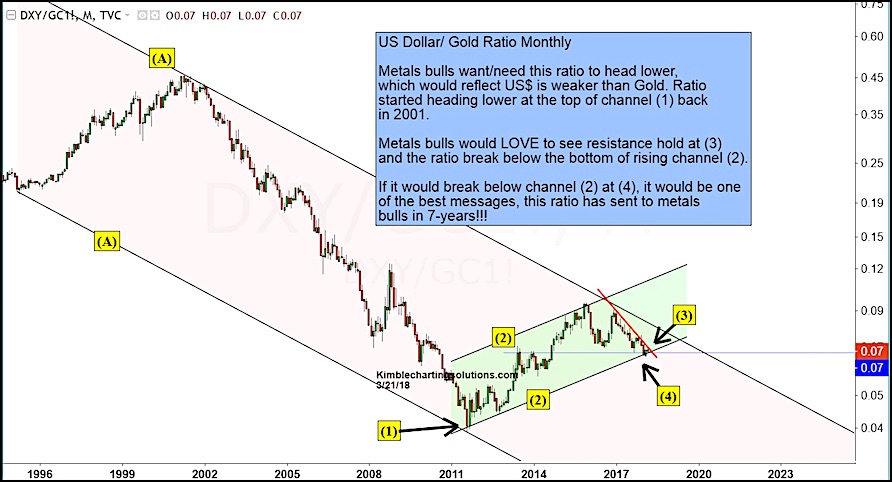
Gold Bulls Hope This Ratio Provides Best Message In 7 Years!
Most investors are familiar with the relationship between the U.S. Dollar and Gold.
Gold bulls like a weaker U.S. Dollar as it provides a tailwind...
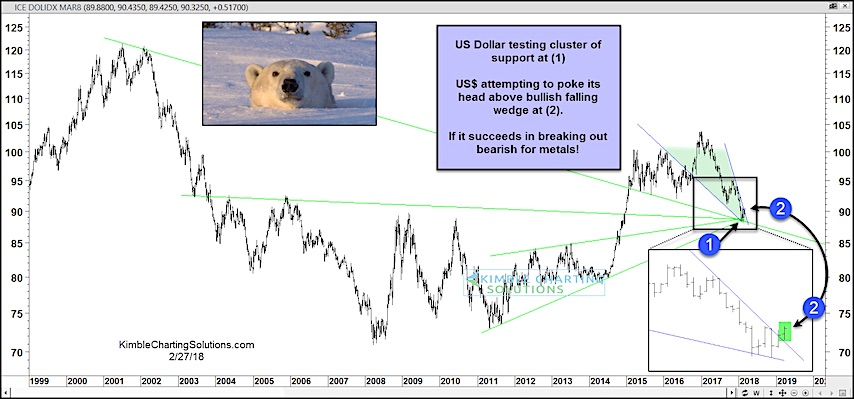
US Dollar Rally May Spell Trouble For Precious Metals!
The last 14 months has seen the US Dollar Index fall nearly 15 percent (top to bottom). Sentiment toward the dollar has turned bearish...
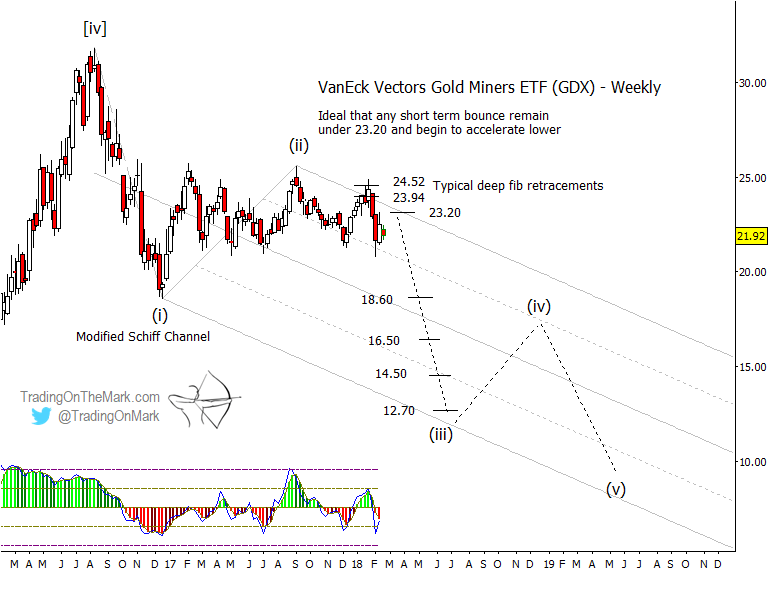
Gold Miners (GDX) Elliott Wave Forecast Points Lower Yet
In December, we highlighted a potential trade developing in the VanEck Vectors Gold Miners ETF (NYSE Arca: GDX). Since that article was posted, we...
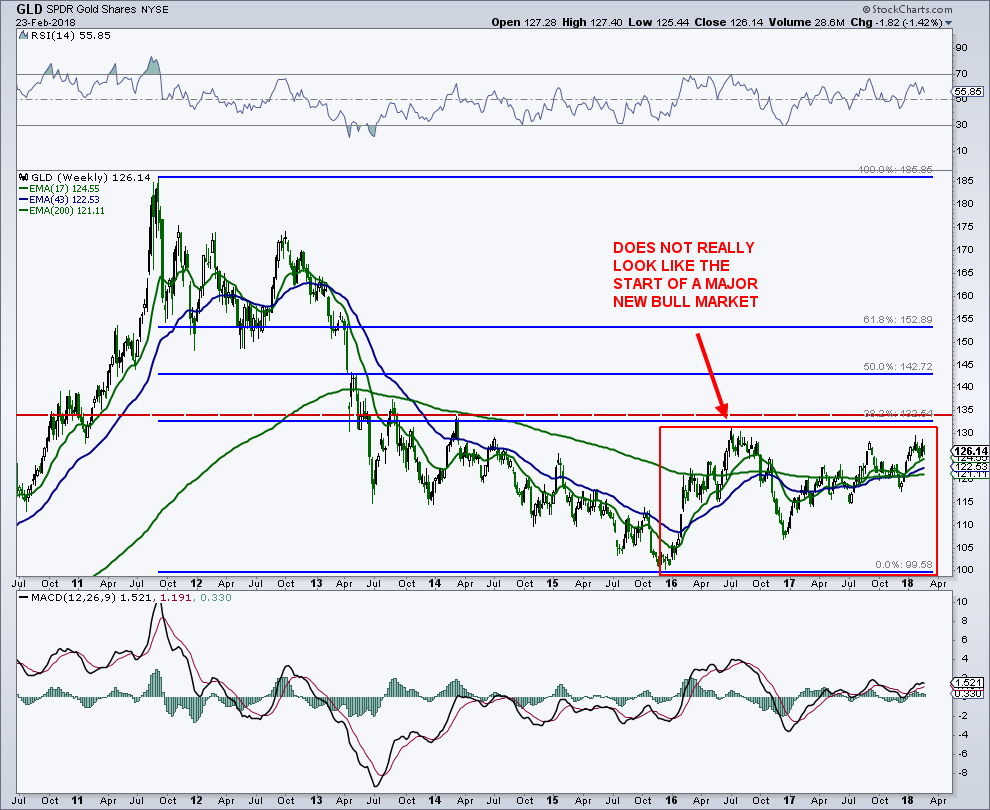
New Gold Bull Market Starting? Not So Fast…
Today, I want to provide a quick update on gold trading and the iShares Gold Trust (GLD). Gold has been meandering beneath major price...
COT Report: Gold Bugs Have Golden Opportunity
The following chart and data highlight non-commercial commodity futures trading positions as of February 13, 2017.
This data was released with the February 16 COT...

