With that said, the rally has so far not been able to draw in new money. For the week ended October 7, equity fund outflows totaled $8 billion. In the past five weeks, only one saw inflows, with cumulative outflows of $14-plus billion (courtesy of Lipper). Money is leaving, taking advantage of the recent strength in prices.
Interestingly, another what could be a potentially important change in sentiment was noticed yesterday. Pre-open, JNJ reported its third-quarter results, beating on the bottom line and missing on the top. The real news was elsewhere. The company also announced a $10-billion buyback. Rather uncharacteristically, the stock yawned – was not able to rally off of that huge buyback news.
If there is a change in sentiment brewing, non-commercials will be rewarded. They have been persistently adding to net shorts in e-mini S&P 500 and Russell 2000 mini-index futures – quite aggressively on the former in particular.
S&P 500 COT Report Chart – Net Shorts
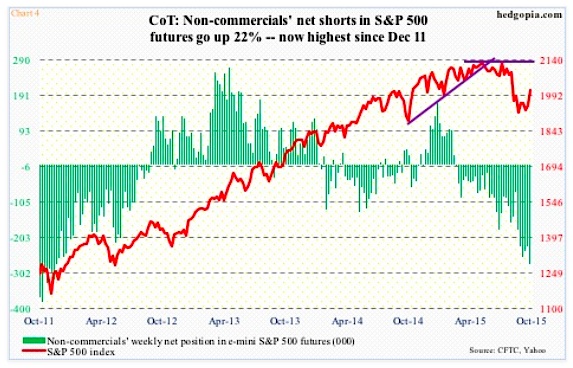
As of Tuesday last week, these traders were net short 278,179 contracts in e-mini S&P 500 futures, and have stayed net short since early March this year. The latest tally is the highest since December 2011 (see chart 4 below). The S&P 500 bottomed on August 24, with a retest on September 29, but non-commercials used the subsequent rally as an opportunity to add to net shorts. As of August 25, they were only net short 75,744 contracts.
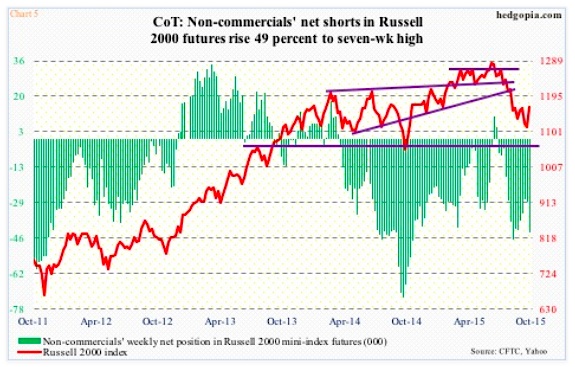
Over on the Russell 2000, it is the same saga. As of Tuesday last week, net shorts were at a seven-week high. In the last couple of weeks, net shorts have gone up 55 percent, even as the index rallied nearly four percent (Chart 5).
Russell 2000 COT Report Chart – Net Shorts
As is the case with short interest, these net shorts can act as a tailwind for stocks if these traders are forced to reverse their positions. While the odds of that happening are low near-term, a couple of things are worthy of attention in Charts 1 and 2.
1. If we focus on the NYSE for a second, back in 2008 when short interest was at a comparable level the S&P index, between October 2007 high and August 2008 low, was already down over 20 percent. This time around, from high to low the index shed 12.5 percent. The bulls have done a good job of absorbing all this selling, but doing that they have expended a lot of buying power.
2. Back then, NYSE short interest peaked at the end of July 2008, but that did not stop stocks from continuing to drop. In fact, by the middle of January next year, short interest dropped to 13.1 billion. Between August 2008 and March next year, the S&P 500 lost another 48 percent.
The lesson? A drop in short interest may not always be a tailwind for stocks. It can be. But it does not have to be. Sometimes, the forces of selling can overpower all the short-covering.
Right now, the bears show conviction, and truth be told, they have been proven right fundamentally – whether it be measured by the deterioration of macro data or earnings deceleration. The question is, would stocks prove them right? Or, even better, do the bulls have enough wherewithal left to stop that from happening?
Thanks for reading!
Twitter: @hedgopia
Read more from Paban on his blog.
Author is net short S&P 500 at the time of publication. Any opinions expressed herein are solely those of the author, and do not in any way represent the views or opinions of any other person or entity.
 Ready To Break Out?")


")


 Rolling Over At Key Fibonacci Level?")