Those four words are arguably responsible for more loss of capital than any other phrase. (Good old John Templeton!) The phrase pops up all the time to explain or justify how the world has changed and those that don’t “get it” are the ones being naive.
It was common during the nifty-50 bubble in the 1970s (Xerox was set to take over the world), during the dot-com Nasdaq bubble of the 1990s (internet revolution) and when the U.S. Federal Reserve could use monetary policy to make recessions obsolete.
While certainly these can be “dangerous” words when used to cajole the unsuspecting, markets are in fact always changing. They change because the behavior of market participants changes. Whether the players are central bankers, active portfolio managers or a group of investors influenced by a crowd-sourcing platform, their actions constantly change and that alters how the markets function.
One of our favourite long-term charts on changing investor behaviour is the average holding period for New York Stock Exchange-listed (NYSE) stocks. This is simply the “average” amount of time an investor holds onto a given position (Chart 1). Yes, in the early 1900s, investors only stuck with a name for a year or two—similar to today. But from the 1930s to the 1970s, investors certainly opted for more of a buy-and-hold approach. Many things contributed to this change in behaviour, from technology, market composition and available strategies. Nonetheless, the average investor’s time horizon is certainly shorter.
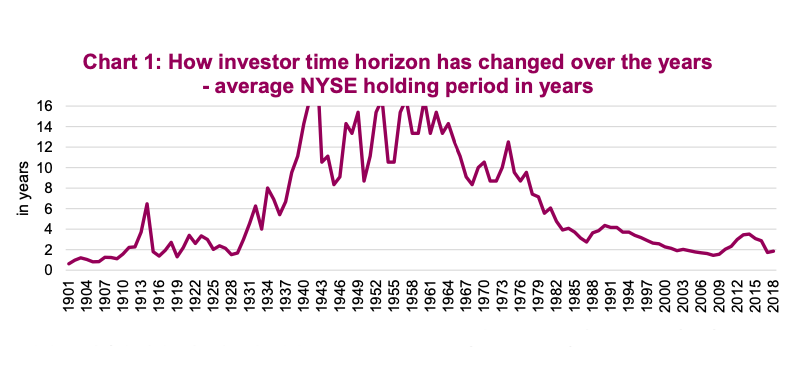
It is unlikely this time-horizon trend will reverse anytime soon; there are simply too many factors contributing to shorter holding periods. Technology and lower trading costs have reduced the friction of trading. Portfolio managers who are more buy and hold often find themselves having to justify fees for such a strategy. Quant strategies contribute to shorter time horizons. And ETFs – they too have certainly reduced time horizons. Very often if an ETF trade is not working even for a short period (aka not performing) investors are quick to hit the sell button. Long gone are the days when you would measure the efficacy of a strategy over a full business cycle (even writing that feels odd in today’s world).
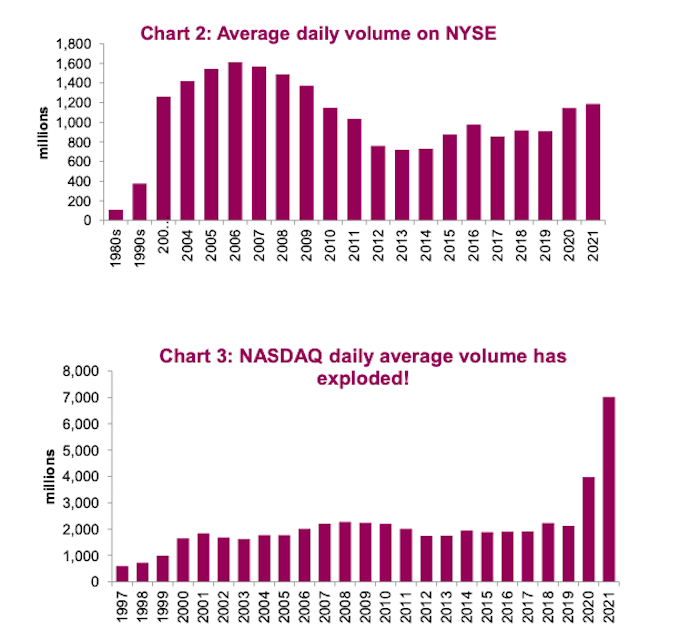
More recently, the rate of increase in trading volumes and activity has accelerated. In contrast, the average daily volume for the NYSE – which peaked in the early 2000s as high-frequency trading become more prevalent, subsided for much of the 2010s.
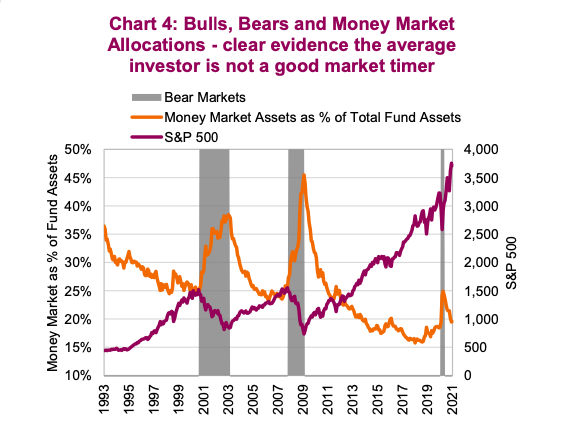
Today, volumes are on the rise in the NYSE mega caps (Chart 2). This trend is much more pronounced in the more speculative markets/exchanges. Reports indicate that penny stock volumes, as a percentage of total volume, are at levels not seen since the late 1990s bubble. Volumes on the NASDAQ have not just entered uncharted territory, but have more than tripled previous records (Chart 3).
Periods when investor behavior and attitudes go through rapid changes occur from time to time. Sometimes these changes occur more quickly and sometimes they revert to “normal” after a while. That of course makes it difficult to discern whether it is a new trend or an aberration. Is the current increase in volumes a more permanent trend or will it revert back ? That is the question concerning many of the new trends over the past couple year during this pandemic.
If the increased volumes in more speculative investments is evidence of investors piling in due to outsized returns and fear of missing out, this trend will only last so long. And we would remind everyone that the average investor does not do a good job at timing the market. Chart 4 shows the percentage of fund assets parked in money market funds over time. You will note that this percentage is at its highest at market bottoms and very low at market peaks. That is literally the opposite of buying low and selling high.
Investment implications
It is fine to dabble in the more speculative corners of the market. There are times that returns in these areas can really provide a performance boost for a portfolio. And those times can go on for longer than many believe they will. Plus, it can be fun. Just make sure that as a percentage of the overall portfolio, speculative trading remains appropriately sized for your risk tolerance because these speculative frenzies do end. Xerox, in case you hadn’t noticed, didn’t take over the world. Amazon/Apple won’t either, nor will electric vehicle (EV) stocks.
[Note: the authors fully understand the network effect and the global will to fight climate change. We also understand the price paid for something is usually the biggest input into your future return].
Enjoy these times, this is one of the more interesting times to be an investor.
Source: Charts are sourced to Bloomberg L.P. and Richardson Wealth unless otherwise noted.
Twitter: @ConnectedWealth
Any opinions expressed herein are solely those of the authors, and do not in any way represent the views or opinions of any other person or entity.
 Rolling Over At Key Fibonacci Level?")


