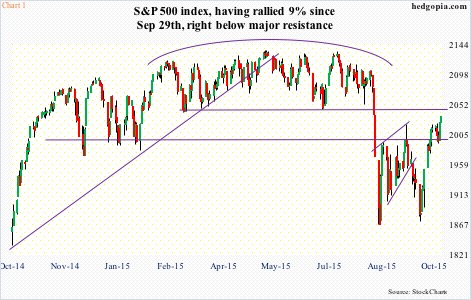
The S&P 500 index rallied 0.9 percent last week – its third consecutive up week. Off the September 29th intra-day low, it is now up 8.7 percent (see chart 1 below). That is in 14 trading sessions!
This is too fast, and probably not sustainable. For all that, though, the price action remains good.
The S&P 500 has rallied past its 50 day moving average (bullish) but is overbought. Currently, it has room to drop 2.4 percent for a test of that average. That said, the rally has also carved out a typical “W” formation. On a weekly chart, there is room for stocks to continue trading higher.
Shorts have a decision to make as relates to the SPDR S&P 500 ETF (SPY).
To refresh, a week ago, weekly October 16th 202.50 calls were hypothetically sold for $0.84. The idea was to generate income at best and go short near resistance at worst. Last week, the trade looked good until Wednesday when SPY closed at $199.29. The next couple of sessions, it rallied nearly four points, closing at $203.27. That position is now a short at $203.34.
The choice traders would have in this situation is this: Get out for a profit of $0.07, or adopt one of the two trading strategies below.
1. Stay short. A strong argument can be made in pursuing this trading strategy. Despite the nice price action the S&P 500 has shown of late, resistance is galore, one of which is broken support-turned-resistance near 2040 (Chart 1). Then we have the now slightly dropping 200-day moving average (2059.9) which should also prove to be a strong resistance level for stocks.
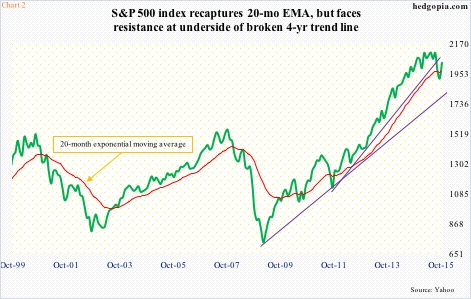
Plus, in September the S&P 500 sliced through its 20-month exponential moving average – the first time in four years (see chart 2 below). With the 5.9 percent rally so far this month, that average has been recaptured. Being able to reclaim as soon as it was lost is definitely a positive. So kudos to stock market bulls.
The next one to watch is the four-year trend line that was violated in August (chart 2). The underside of that trend line lies around 2050.
Plus, technically, 61.8-percent Fibonacci retracement is considered very important. Last Friday, the S&P 500 closed at 2033.11, darn close to 2032.45, which retraces 61.8 percent of the May high (2134.72) and August low (1867.01) decline.
2. Stay short but at the same time deploy options. The rally so far has surprised many. In the last six weeks ended last Wednesday, there have been $12 billion in outflows from U.S.-based equity funds. Despite this, the bulls have successfully taken care of resistance at 1990 and then 2020 on the S&P 500. Short interest remains high, which probably helped.
Nonetheless, shorts have not gotten aggressive where they could possibly have. On both Wednesday and Thursday, buyers stepped up near the rising 10-day moving average.
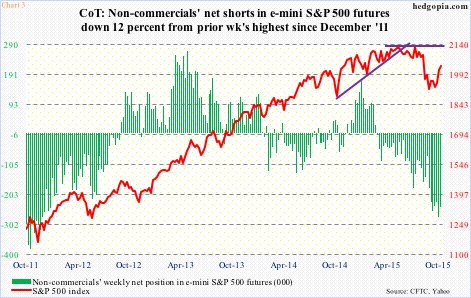
In the futures market, non-commercials reduced net shorts in e-mini S&P 500 futures by 12 percent from prior week’s nearly-four-year high of 278,179 contracts (see chart 3 below). They still lean massively bearish, but did cut back a tad (by Tuesday last week). Would they aggressively add to net shorts or begin to cover if/when the S&P 500 nears the afore-mentioned resistance? We will just have to wait and see.
What we do know is this. Daily conditions are way overbought on the S&P 500/SPY. But at the same time, based on the price action so far, bulls will probably not give up easy. In this scenario, a hypothetical short put might come in handy.
Weekly October 23rd SPY 202 puts fetch $0.82. These are essentially covered puts. If they get put, then the short position gets covered for a profit of $2.16. If SPY rallies, then the short price rises to $204.16.
Thanks for reading!
Twitter: @hedgopia
Author has a short position in SPY at the time of publication. Any opinions expressed herein are solely those of the author, and do not in any way represent the views or opinions of any other person or entity.


")
 Rolling Over At Key Fibonacci Level?")


