One of the stocks I’ve been following closely from a “price” perspective is Yahoo! Inc. (YHOO). Yahoo stock has provided some nice price patterns for pure price guys like myself. Back in January, I made the case for YHOO going lower and offered some downside price targets.
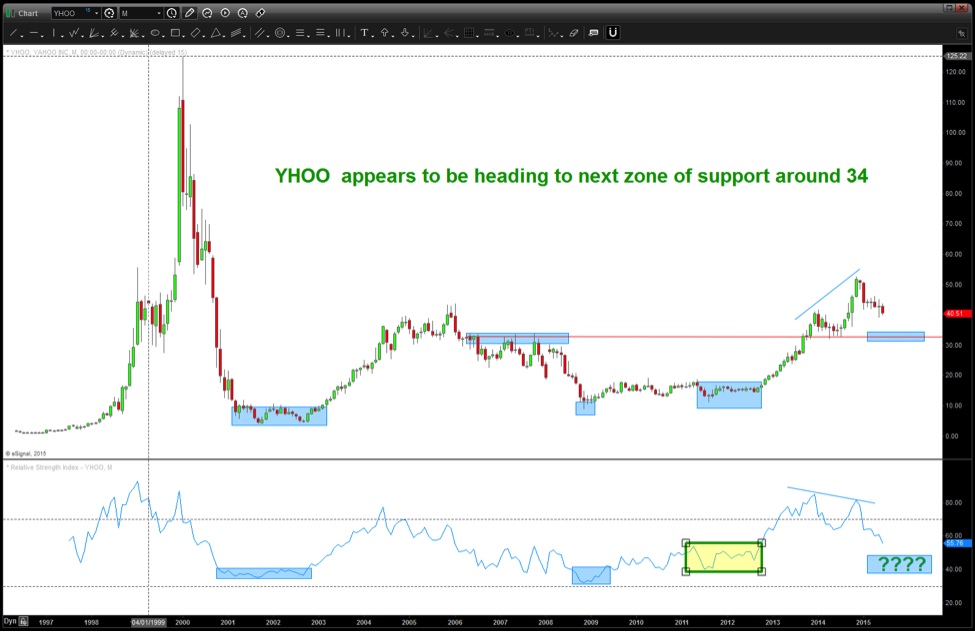
Today, I wanted to provide a quick update on where I think the YHOO is at. Looking at the chart below, you can see that key price support around 43 has failed and thus the stock will likely be targeting 34 in the coming weeks/months.
Of particular note, pay attention to the Relative Strength Index (RSI). When the move began near 10 in 2011, the RSI support zone “shifted” higher. And as the stock has been drifting lower one might expect this level to work as support again.
There is currently no clearly defined buy pattern that warrants attention just yet but I expect the RSI and the 34 level to offer stronger support a little lower. click to enlarge chart
Yahoo Stock (YHOO) – Monthly Chart
Thanks for reading and have a great week.
Twitter: @BartsCharts
No position in any of the mentioned securities at the time of publication. Any opinions expressed herein are solely those of the author, and do not in any way represent the views or opinions of any other person or entity.


")