 I recently spent some time in Las Vegas attending the Consumer Electronics Show (CES), one of the Strip’s largest shows of the year. Guest attendance this year was around 200,000 people. The technology was amazing. As I was waiting for a cab back to my hotel on one of the days… staring me right in the eyes: Wynn Resorts (WYNN).
Previously, I had been watching Wynn Resorts stock for signs of weakness and correlating that to the overall market for discretionary spending/gambling/playing that is synonymous with Las Vegas. Using patterns to identify inflection points, “my theory” was IF WYNN is correcting or going down THEN the economy will (more than likely) go down with it… or at least show that people aren’t going crazy and are “risk averse”, so to speak.
Check out these links to follow my coverage of WYNN and its chart pattern developments:
- This one was a beauty. NOTE the TIME (blue shaded) triangle was equal to the move up into 2007 after the IPO.
- Also note the measured moves (blue arrows) are responsible for all of the moves in WYNN.
- I wanted to include this chart/blog because it shows that the PATTERNS do fail and are not 100%. I like to say they are 100% correct because they let you know where you are wrong. Since the target was taken out, another target was developed and that hit perfectly, per above.
So where is Wynn Resorts stock at now?
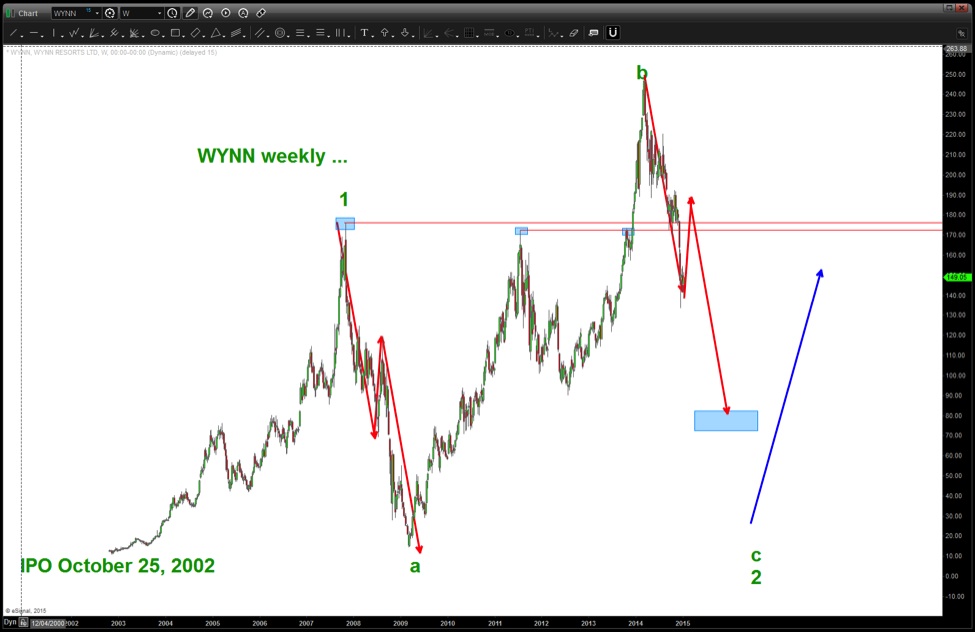
- Note in the chart below that we corrected more than 2011-2012 and have just completed (almost perfectly) a measured move down using the red arrows.
- Perhaps a rally from here and then down again?
- The blue shaded tops held for a little bit but were ultimately taken out to the downside. Note the strength of the red candlesticks as these former tops did not hold.
- This is not bullish for WYNN.
- See how we made 3 waves up from the 2009 low? CLASSIC B wave so perhaps we are in a devastating C wave down to the high/mid teens.
- Overall, I don’t see anything to do right now. I would submit, however, that WYNN taking this beating isn’t because the consumer is going hog wild in their resorts and casinos. Yes/No?
WYNN Resorts Weekly Stock Chart
Thanks for reading.
Follow Bart on Twitter: @BartsCharts
No position in any of the mentioned securities at the time of publication. Any opinions expressed herein are solely those of the author, and do not in any way represent the views or opinions of any other person or entity.

 Rolling Over At Key Fibonacci Level?")


 Rolling Over At Key Fibonacci Level?")
