We are revisiting the crude oil market this week, because there probably are some trades nearby in the popular United States Oil Fund ETF (USO). When we last posted on this topic in July, we mapped a course for Oil prices to continue declining into support targets that were considerably lower than most analysts were projecting. After testing the lower target area on the earlier weekly chart, Crude Oil futures prices have bounced in what appears to be the start of something larger.
Usually we start by examining the big picture and then work our way down to smaller time frames, but this time we’ll go in the opposite direction.
The channel drawn on the weekly chart for the popular Oil ETF (USO), shown below, should be one of the best tools to monitor whether the upward trade is working. Price has already made a decline into a target area for the Oil ETF, and we have placed the channel so that it best matches up with the structure of that decline.
Since the decline was composed of five waves, labeled as [i]-[ii]-[iii]-[iv]-[v], we would expect a three-wave upward corrective structure to develop next. Also, the segments of that corrective structure should be similar in magnitude to the waves of the prior decline. Thus, we might expect the first sizeable corrective wave higher for USO to test the area near the top of the existing channel. That would make the move similar in size to the earlier wave [ii].
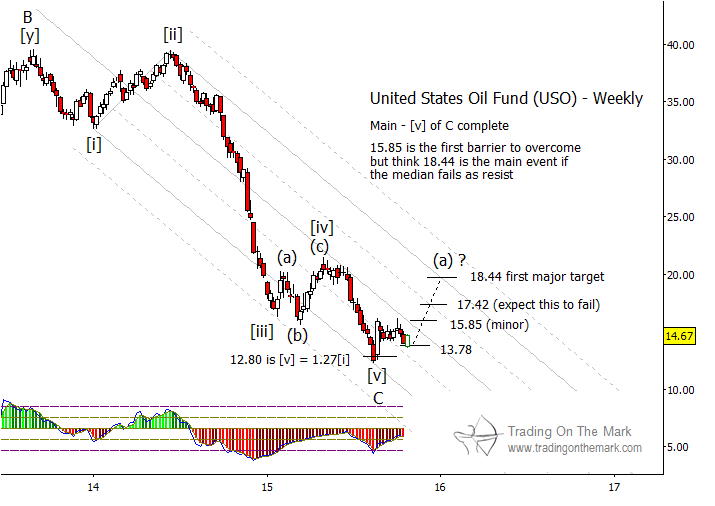
The upper channel boundary on the weekly chart probably will represent the main resistance that a corrective move needs to overcome, and we have drawn additional Fibonacci-based resistance levels that price may respond to during its journey. Depending on one’s time frame as a trader, the best way to approach a move like this may be to watch for the price of USO to pull back into areas of support (such as the 13.78 level shown) and then look for confirming signals on an even smaller time frame to indicate an opportunity to try a long position. If the trade is working, then USO should reach to test near – but perhaps not precisely at – the next resistance target on the ladder. At the same time, it is important to have a firm idea about what signals would indicate that the trade is not working, and a trader should always put protective stops in place.
In the bigger picture, a corrective move higher in crude oil prices and USO could last several months or even a year. At this point, the most likely scenario is that the move should consist of three waves, and the expected wave (a) drawn on the weekly chart might be the first of those.
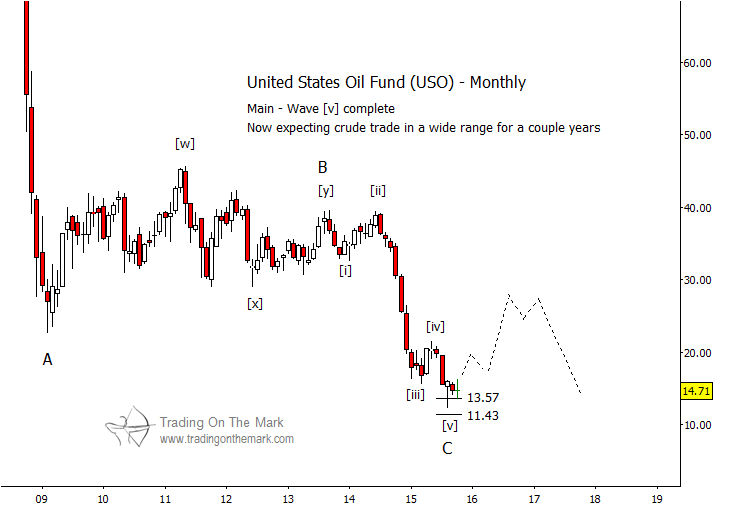
While we expect crude oil prices to increase substantially in coming months, we believe they will continue to trade within a range approximately as shown on the monthly chart above. The price lows of 2011 and 2012 represented earlier support, and that general area now represents resistance for oil prices. Thus, we would expect any upward corrective pattern to stay mostly below that area into the foreseeable future.
If this type of analysis is helpful in your trading and investing, let us know that you would like to receive an occasional newsletter. It offers big-picture analysis and perspectives delivered to your inbox every few weeks.
Twitter: @TradingOnMark
No position in any of the mentioned securities at the time of publication. Any opinions expressed herein are solely those of the author, and do not in any way represent the views or opinions of any other person or entity.


 Ready To Break Out?")


