 Since the Spring 2012 stock market correction, each market pull back has been smaller and “tighter”, producing a coiling effect. As well, each of the past 3 stock market corrections, all occurring in 2013, have been closer together in time and followed the same textbook: tag rising resistance and retreat. This may be too cute of a pattern to produce a 4th touch and go, but I wanted to post a chart illustration highlighting that scenario.
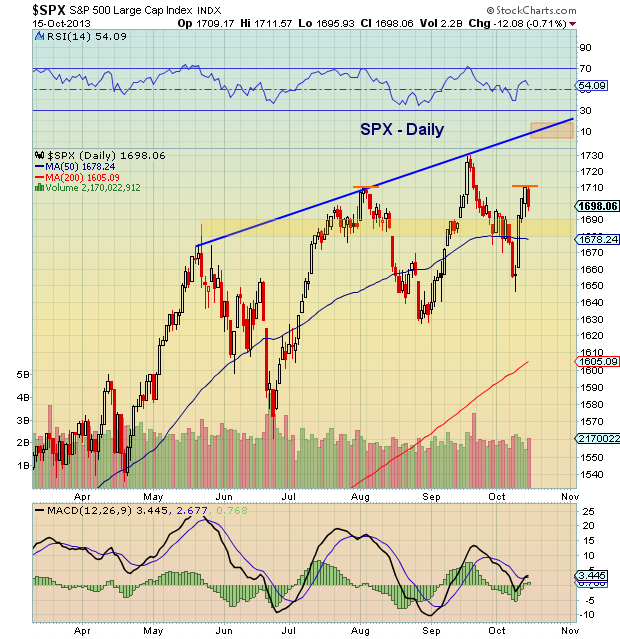
In the chart below, it is clear that the S&P 500 is bumping up against resistance at 1710-1711. Aside from the recent highs (1729), this is the only resistance of note. So, above 1711 opens up 1729 and 1745-1760. As well, the index is on bar 5 of a daily sell setup that, if continued, could bring a short-term top as early next week.
BUT, should the S&P 500 continue to bump its head off 1711 and fail to clear that level, then all bets are off. This could come down to a game of “Deal or No Deal,” as the government shutdown runs perilously closer to the debt ceiling deadline. And any continuation of the “games” past the October 17 deadline likely will not sit well with Mr. Market.
Trade safe, trade disciplined.
Twitter: @andrewnyquist
No position in any of the mentioned securities at the time of publication. Any opinions expressed herein are solely those of the author, and do not in any way represent the views or opinions of any other person or entity.

")


")
