U.S. home builder sentiment jumped five points in June to 59, matching the post-bubble high reached last September. The current reading is the highest since November 2005, which was at 61. Sentiment fell to as low as eight in January 2009.
Let’s look review the data at hand.
- U.S. home builder sentiment jumps in June, matches post-bubble high (September ’14)
- Recent spike in interest rates could potentially be shot across housing bow
- Home construction ETF (ITB) acting tentative, needs to hold crucial support at 26
There has been quite a recovery for home builders and home sales. Can it continue? Or will rates and the economy disrupt the recovery?
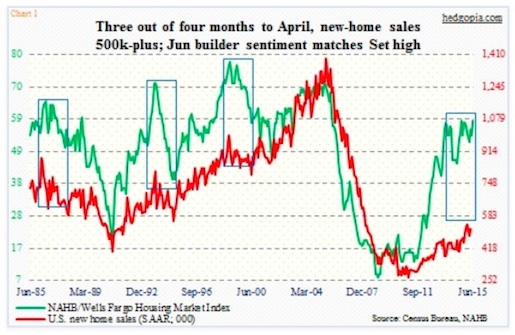
It is worth noting that the NAHB sentiment survey and housing fundamentals do not always move hand in hand. The chart above plots builder sentiment against new home sales. It turns out the former more often than not tends to run ahead of home sales. Quite a few times in the past when that has happened, the green line ultimately has followed the red line lower.
Which begs the question, what, if any, are the risks of that happening again?
The latest spike in builder sentiment has come at an interesting time. Interest rates have spiked of late. For the first time since last November, the U.S. 30-year conventional fixed mortgage rate is north of four percent. Late April, it dipped to as low as 3.65 percent. The cycle low of 3.35 percent was reached in December 2012. Despite a higher low in November, rates are still very low historically.
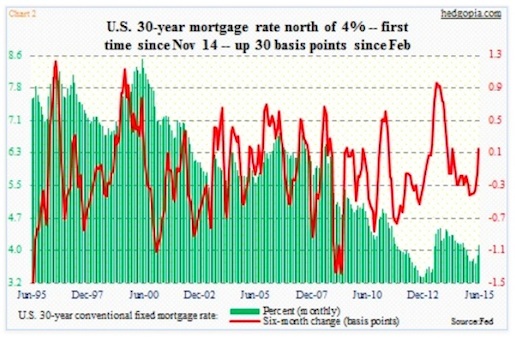
Nonetheless, lots of times it is the rate of change that matters, not just the level. From that standpoint, for the first time since last April, the six-month change in the 30-year fixed mortgage rate has gone positive. Since January, the red line in the chart above has decidedly hooked up.
With this as a background, the spike in builder sentiment is a head-scratcher.
Here is what could be going through their minds: (1) Recent spikes in mortgage rates are not going to stick. (2) Even if they stick, that may very well end up coaxing potential buyers into action. (3) Rates are historically low, hence a small rise in rates would not matter much, particularly considering the momentum in job creation as well as household formation. Since last August through March, an additional 1.1 million households have been created.
If instead of focusing on volatile monthly data, we run a 12-month average of housing starts (not including today’s numbers) as well as sales of new and existing homes, all three are close to or at cycle highs (one million units, 517,000 units, and five million units in April, respectively). Granted activity is subdued, but the trend is up. Is that the reason why builder sentiment is hanging in there?
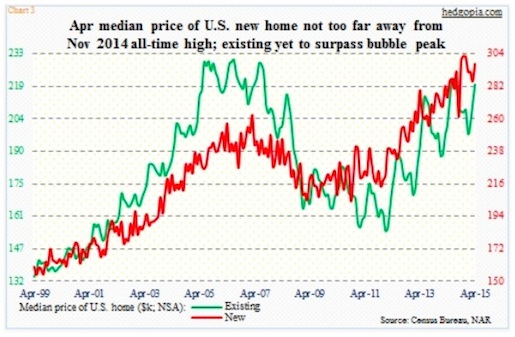
Possibly. But mortgage rates better not gather upward momentum. Of late, ultra-low rates have provided the most tailwind to housing prices and home sales. Income growth has been sluggish, and home prices have had quite a recovery. The price of a new home recorded a new high last November ($302,700), with April at $297,300. The price of an existing home is yet to exceed the July 2006 high of $230,400, but April’s $219,400 is not that far behind (see chart above).
This kind of price momentum does not help build momentum in housing. Low rates have helped, but the recent spike is a warning shot across the housing bow. To what extent do investors/traders fear the rate repercussion should begin to get reflected in the iShares Home Construction ETF (ITB).
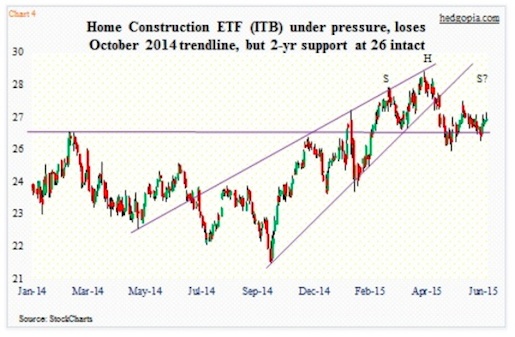
Yesterday, the ETF could not quite hold on to gains that came on the back of the sentiment data as well as the proposed merger between Ryland Group (RYL) and Standard Pacific (SPF). Support at 26, going back two years, has already been tested once this month – successfully at that. Here is something to keep an eye on. If it manages to rally a point or so and then stalls, ITB would have formed the right portion of a head-and-shoulder formation (see chart above). The 26 support will then take on added importance.
If it breaks, that is markets’ way of saying the green line in the first chart above is headed lower for a rendezvous with the red.
Thanks for reading.
Twitter: @hedgopia
Read more from Paban on his blog.
No position in any of the mentioned securities at the time of publication. Any opinions expressed herein are solely those of the author, and do not in any way represent the views or opinions of any other person or entity.


 Rolling Over At Key Fibonacci Level?")