Perhaps the two hottest themes in the markets right are the move in the US Dollar and what is going on in the Biotech sector. I have hit on the USD a few times, but let me take a shot at Biotech. More specifically, I want to highlight the chart of one of the largest holdings in the iShares Biotech Sector ETF (IBB) – Gilead Sciences (GILD).
And although negative news over the weekend regarding heart related concerns with Gilead’s Hepatitis drugs will likely hit the stock, GILD still has a clearly defined chart setup.
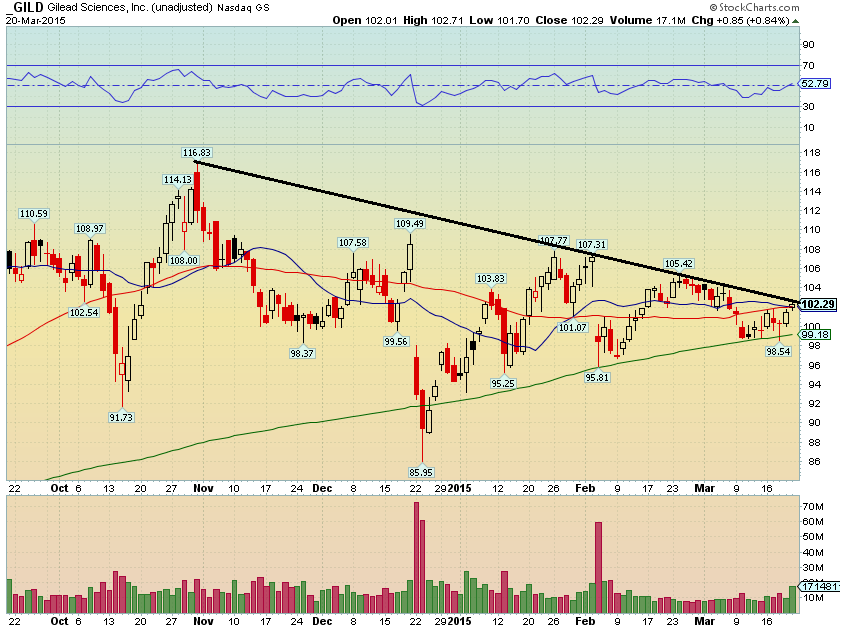
You can see in the 6-month chart below of GILD that Gilead Sciences stock price has been in consolidation mode. A move above the black resistance line would indicate a price breakout and imply a bullish continuation of the trend higher. The price objective would be calculated as follows: the high minus the low, added on top of the breakout level (putting numbers to that: 117-86=31 + 102= 133). These are not hard-and-fast numbers, but it gives you a sense of the expected move if there is a bullish breakout on Gilead Sciences stock chart. I am watching GILD patiently. Note that the first support area for GILD is at the rising 200 day moving average (99.18).
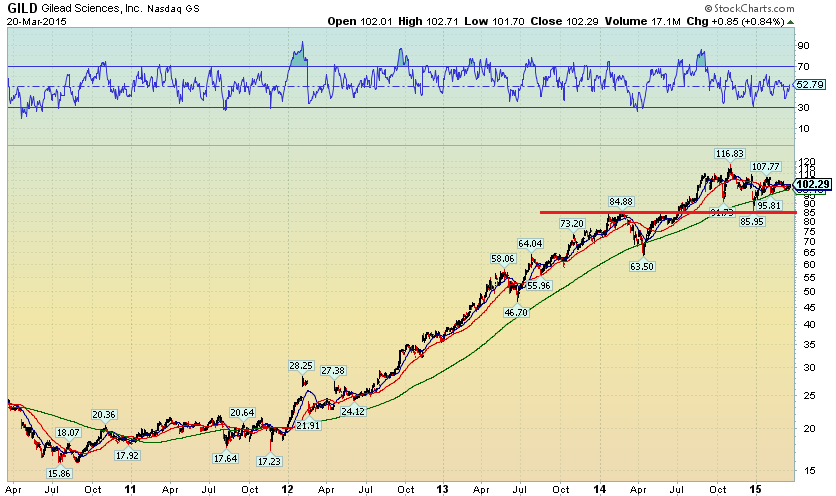
Whenever I find an appealing near-term chart, I like to at least get a sense of the longer-term story. The 5-year chart below shows the remarkable bull market that has taken place in Gilead Sciences stock (and Biotech in general). GILD is consolidating within a long-term uptrend. The presumption here is that the stock will move above the coil consolidation pattern and resume its uptrend. Note the prior breakout above 85 was successfully tested. A stop below this level would make sense, however many swing traders would prefer not to take that much downside risk.
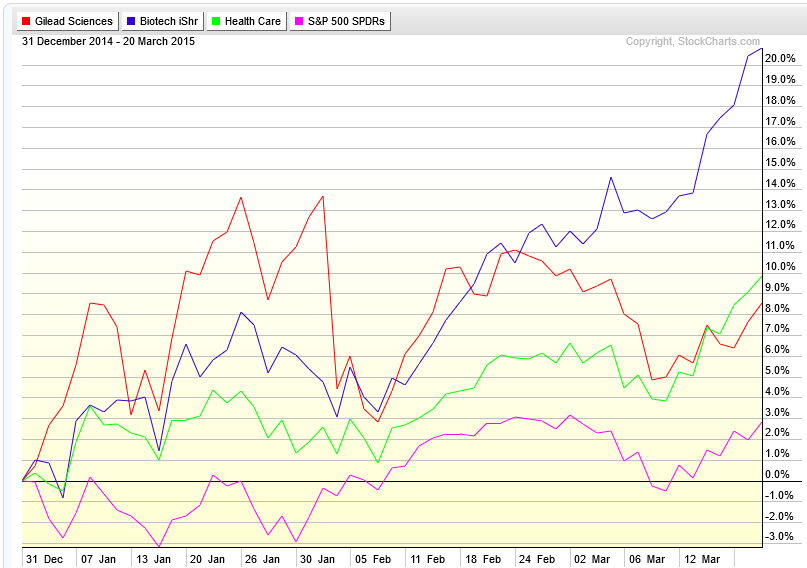
Another perspective I like to gain when choosing a stock to trade is the relative strength picture. The next chart shows the year-to-date performance of GILD, IBB, XLV (SPDR Health Care Sector ETF), and SPY (SPDR S&P 500 ETF). This gives you an idea of how Gilead Sciences stock is performing relative to its industry, broader sector and the overall market. You may be a bit concerned that GILD is underperforming its closest peers. Taking a step back, however, you have to consider the near-term chart showing a bullish consolidation pattern. This tells me GILD could lead the next leg higher in the IBB ETF.
On a broader note, IBB and XLV continue to show relative strength to the S&P 500.
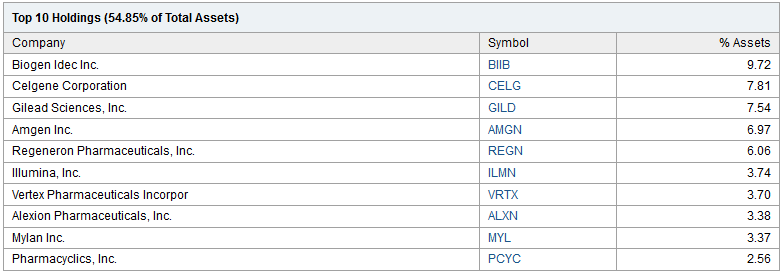
If you are curious about playing the IBB ETF, you should be aware of the components. GILD is one of the top holdings, so a breakout in GILD will certainly benefit the industry ETF. While a move lower will likely take the steam out of both.
Thanks for reading.
Follow Mike on Twitter: @MikeZaccardi
No position in any of the mentioned securities at the time of publication. Any opinions expressed herein are solely those of the author, and do not in any way represent the views or opinions of any other person or entity.


