In order to fully comprehend the story of the Canadian Dollar (the Loonie), the US Dollar, Crude Oil, and the Oil Services Index, you may need to go back about a year and examine the price charts. In a post I wrote over a year ago (and I highly recommend reading), the charts were showing an amazing divergence between the Oil Services Index and the USDCAD. And it did indeed prove important.
Today I’d like to take another look at these relationships to see where we are at now. And what I expect next.
But before I get too in depth, here’s a quick recap:
- Crude Oil prices crashed.
- There was a parabolic spike in the USD vs the Loonie
- We saw a “normal” correction in the Oil Services Index
- The US Dollar Index is going parabolic
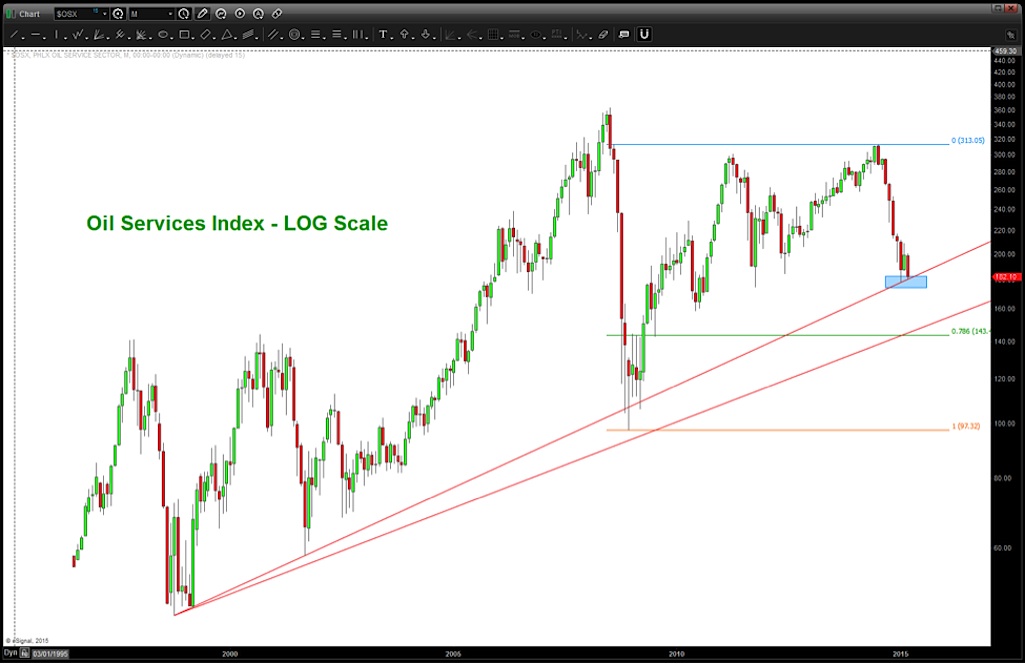
Oil Services
Let’s dig in to the Oil Services Index first. As you can see in the chart below, the long-term log scale trend line is being tested. A break of this trend line “should” test the secondary trend line and set up the 140’s as a very crucial (and potentially “buying” support).
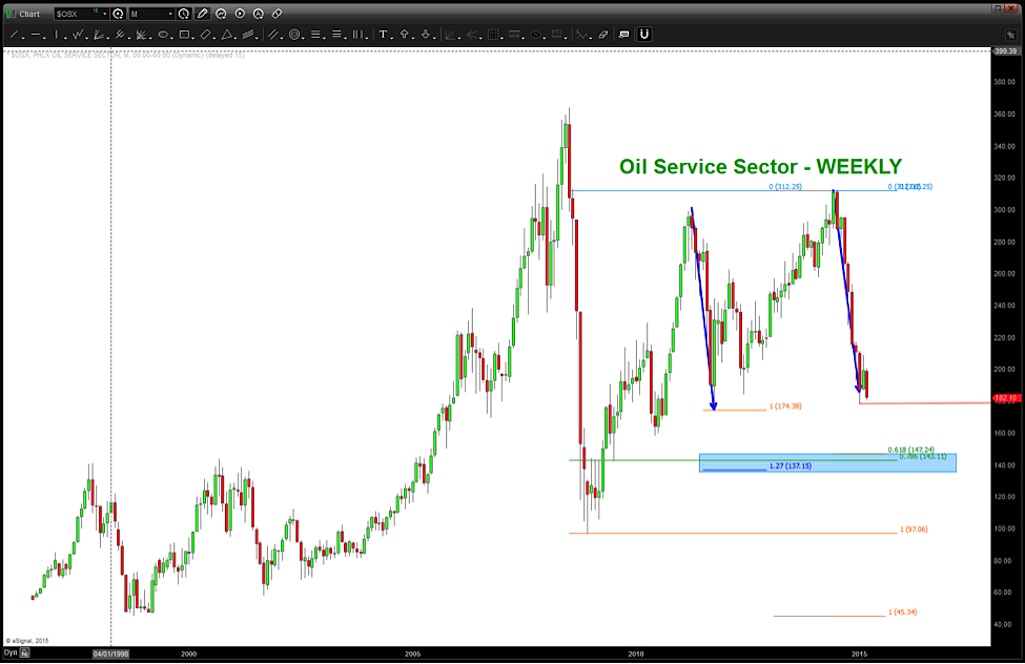
When I made this call (Why I Think 44.22 Is The Low For Now On Crude), it’s important to note the PRICE and TIME corrective move occurring on the Oil Services Index while the .618 price projection on Crude Oil was being attacked (44.21).
Also, notice that I said “for now.” The count wasn’t complete and one more leg lower should be in the cards for both Crude Oil prices and the Oil Services Index. When we break to new lows, I believe the highlighted light blue arrow will be the next price target.
CAD vs USD
Note this is inverted from the usual FX picture of the USDCAD pair. I am doing this to present the synergies present in Crude Oil, the Oil Services Index, and the Loonie. This certainly looks very heavy but that’s due to the waterfall move down (and/or the parabolic move up in the USDCAD). A “natural” LOONIE vs USD target is shown below, along with an extended one below it at .6851 LOONIE vs USD.
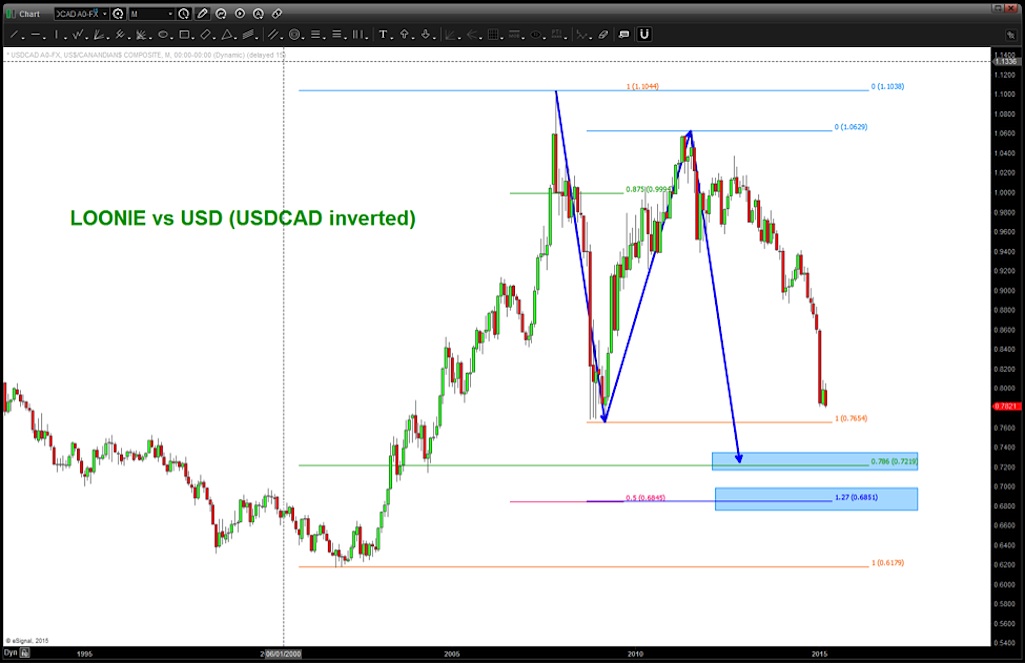
HOWEVER – remember to monitor Crude Oil and the Oil Services Index as I believe they will all bottom together.
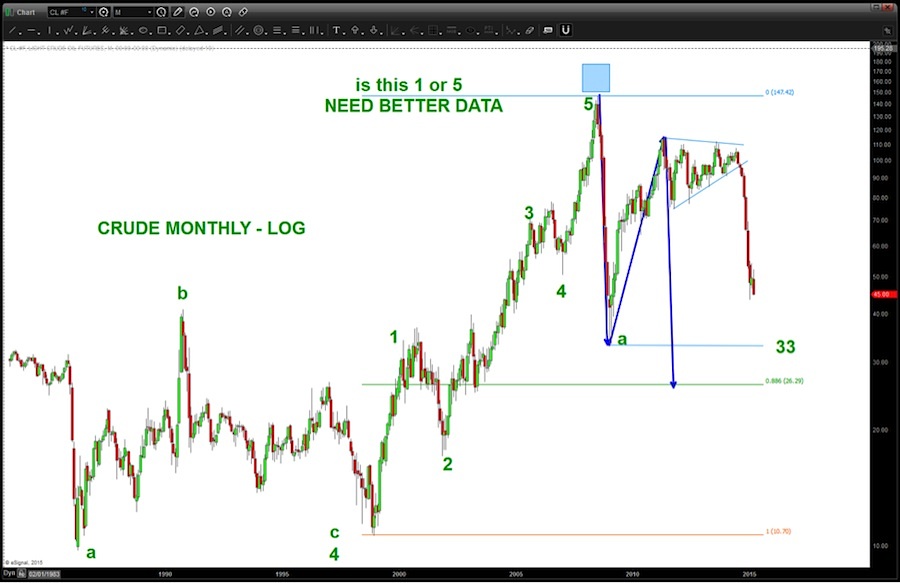
CRUDE Oil
I believe we will see another wave lower in Crude Oil prices. That wave should correspond to either 33 or 26 as the final target before a broad, multi-month advance.
Here is one final chart showing the synergies between Crude Oil, the Loonie vs USD, and the Oil Services Index.
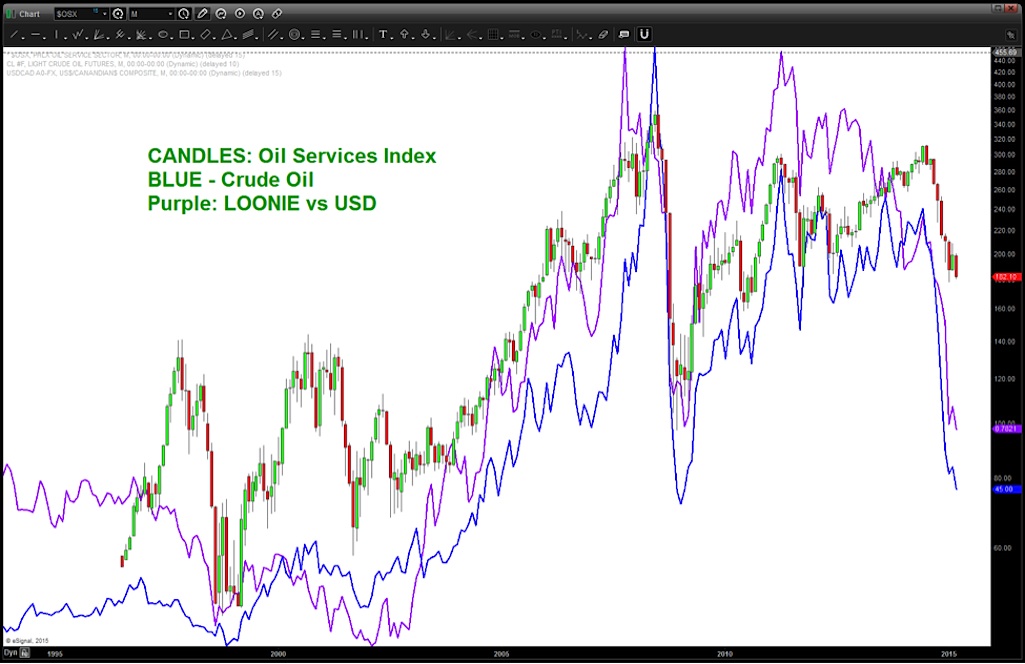
Some takeaways form the charts above:
- Candles: Oil Service Index
- Blue Line: Crude Oil Continuous Contract
- Purple Line: LOONIE vs USD
- I believe the probabilities are rising that they will all bottom together.
- Additionally, they all appear to be have lower targets (still heading lower).
So it appears, over the coming months that there will be a very nice opportunity to manage risk. I will be watching for simultaneous confirmation of 3 targets being hit on the Oil Service Index, the LOONIE vs USD and Crude.
Thanks for reading and I hope you had an awesome PI day!
Follow Bart on Twitter: @BartsCharts
No position in any of the mentioned securities at the time of publication. Any opinions expressed herein are solely those of the author, and do not in any way represent the views or opinions of any other person or entity.


