It’s been a while since I posted on the relationship between Crude Oil, stocks, and the global economy. At the time of my last post, Crude Oil prices were continuing down from their July peak. At that time, those of us who follow oil to gauge where the stock market may be heading next were looking at stocks with caution. In the article, I opined that 2012 levels were likely supports and resistances for oil and bonds, respectively. I also compared the US economy to where it was in 2012.
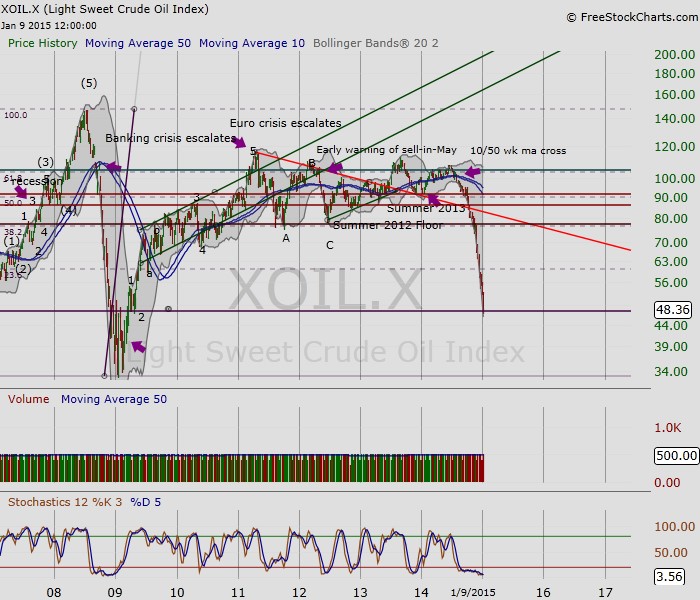
In retrospect, it was a mistake to fail to take into account the impact of falling oil for commodity-producing countries. So today, oil prices have not only dropped below 2012 supports, but have now entered 2009 levels. At these levels, we can expect traders to begin arguing amongst themselves about where the next low will take place. This is likely to create some increased volatility in oil… which should spill over into other markets (i.e. stocks).
Below is the weekly chart of Light Crude Oil futures. The boom and bust of oil has led the equities markets lower and eventually higher. This season, stocks continue to defy gravity, although performance has been unimpressive, and with marked volatility.
Light Crude Oil Prices – Weekly Chart
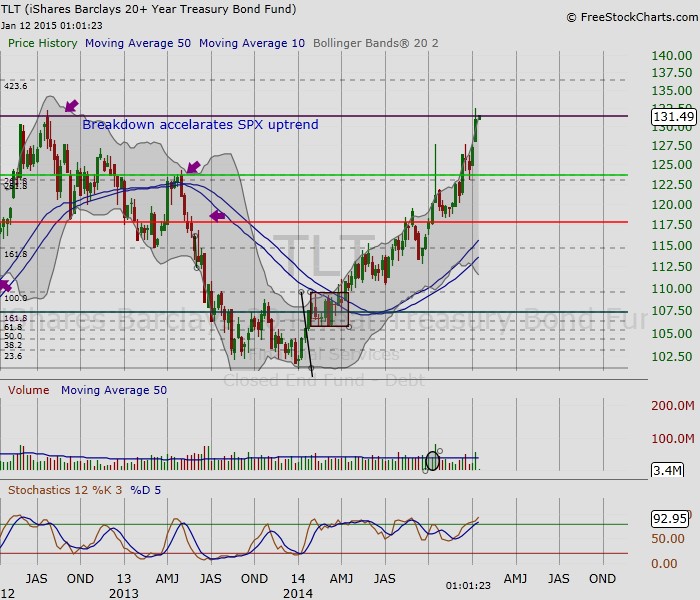
The following chart is the 20+ Year Treasury Bonds Fund (TLT). The TLT is back again at its 2012 summer peak. The long-term bond action has spooked bank traders. And considering that banks and retail are leading barometers for the economy (and consumer) it’s important to note that both SPDR Retail ETF (XRT) and and SPDR Financial ETF (XLF) have developed red candles since the TLT broke out above resistance in recent weeks.
That said, XRT and XLF’s price action, when measured against the recent improvement in wage data, might indicate that the uncertainty is less tied to the consumer than it is with overall concerns about the collapse in Crude Oil and what this means for the global economy.
Perhaps the US equity market is simply attempting to figure out if and how a global economy will impact the US economy.
20 Year+ Treasury Bond (TLT) Weekly Chart
‘Don’t Catch a Falling Knife’ and Don’t Ignore the Lessons of 1987.
Who is not familiar with this trader’s adage from the original trader’s bible, Reminiscences of a Stock Operator by Edwin Lefevre. Less familiar may be the lesson from John Murphy’s Intermarket Analysis: Profiting from Global Market Relationships: In the early chapters, Murphy details the relationship of oil and equities and the warning of the “death cross” between the two. He argues that what happened with stocks in 1987 was forewarned by oil. The lead/lag relationship between oil and equities has been consistent in recent years, except for these last few months. This begs the question: will equities finally follow oil? The 2009 lows are fast approaching. Is this time different?
Thank you for reading.
References:
Murphy, John (2004). Intermarket Analysis: Profiting from Global Market Relationships (John Wiley and Sons, Inc.: NJ)
Follow Maria on Twitter: @rinehartmaria
No position in any of the mentioned securities at the time of publication. Any opinions expressed herein are solely those of the author, and do not in any way represent the views or opinions of any other person or entity.


