A few days ago I tweeted that the iShares Nasdaq Biotechnology ETF (IBB) looked to have entered a period of clear “distribution”, meaning that strength begets selling rather than the opposite. It is not shocking since in DeMark terms the Biotech Sector ETF is printing ominous “exhaustion” signals on daily, weekly, monthly and quarterly charts. But I’ll discuss the DeMark ‘tells’ later.
First let me offer a few reasons why I think the Biotech Sector is under distribution:
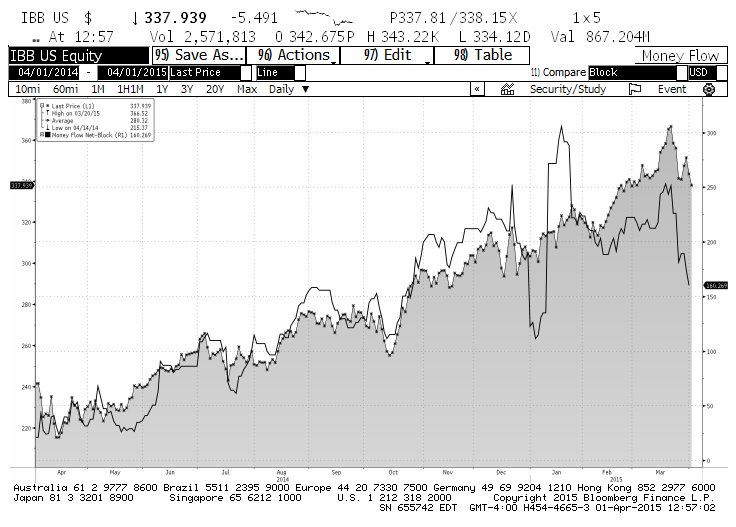
1. There is an obvious and odd divergence between price and shares outstanding: As in most ETFs, when demand for the fund increases and money flows in, the sponsor issues additional shares to accommodate the new buyers. In a “normal” world marginal new buyers should push the price of the ETF higher and vice-versa. That has not been the case of late. As you can see from the chart below, the price (brown line) has dropped almost 10% from the March 20 highs, while yesterday the number of outstanding shares (blue line) made a new high. Traders are trying to catch the falling knife.
IBB Biotech Sector ETF – Number Of Shares Outstanding
2. “Block” money flow is to the sell side: Bloomberg tracks trades of 10,000 shares or more on the buy side or sell side. Over the last year, large block sales were absorbed relatively easily and the price kept marching on. During the last few days large sellers are impacting the price. This suggests that the “knife catchers” are smallish traders who are having trouble absorbing the supply.
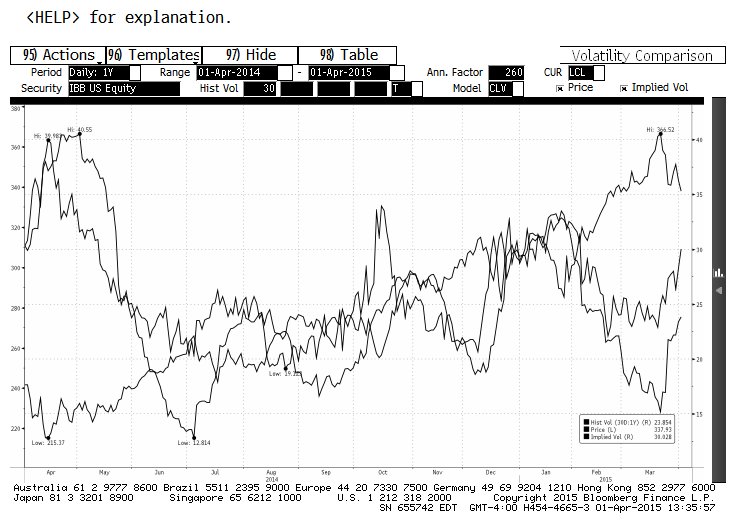
3. Volatility is rising: If one subscribes to the theory that an increase in volatility can be viewed as a “decrease in liquidity”, a sustained rise in implied and historical volatility suggests that one side of the trade – the bid in this case – is getting thin. Over the last year there have been a couple of sustained pops in volatility, but again, price quickly recovered. The Biotech Sector ETF (IBB) looks to be having a tougher time this go around.
On their own the above yellow flags would be enough to give me pause about staying long IBB. But when these signals show up together with DeMark charts that scream “buyers are exhausted!!”, it sets up a very good opportunity on the short side, or at least to hedge one’s positions in the space.
As I stated earlier, IBB shows “Buy Exhaustion” signals on daily, weekly, monthly and quarterly charts. Exhaustion counts that appear nearly simultaneously on multiple timeframes are exponentially more effective than on a standalone basis. Without getting into the arcane aspects of it (you can read more about DeMark here), one can think of these indicators as measuring when buyers (or sellers) with different time horizons are likely to have run out of buying power. Therefore, when DeMark counts suggest that buyers on short, intermediate, long, and “buy and hold” time horizons have essentially done all their buying, it is not a stretch to suggest that all these holders are now resting on shaky ground. That’s the predicament that IBB longs appear to be facing.
Here are some details for those who understand DeMark technicals:
- The daily chart has printed bar 12 of 13 of a Combo Countdown Sell. Yesterday there was a bearish “Price Flip” with a close below TD Reference Close Down. The latter needs confirmation through a lower open and lower low tomorrow morning.
- On the weekly chart there is an active Perfected Sell Setup (“Risk Level” at $368), which will be confirmed by a “Price Flip” if the IBB closes below $342.36 today. The Combo Countdown Sell has reached 12 of 13 bars, and the break of the $327.76 “Risk Level” off of the prior completed Combo Countdown Sell remains non-qualified.
- On the monthly chart a Perfected Sell Setup completed yesterday. “Risk Level” for this signal is all the way up at $430, which is not very helpful, so I would use risk management based on weekly levels ($368).
- The quarterly chart shows a completed Combo Countdown Sell and it’s very likely that it will complete a Sequential Countdown Sell at the end of June (unless the price craters before that). The “Risk Level” off of the Combo Sell sits at $328.51, so it has been breached but on a non-qualified basis.
Those who understand DeMark analysis realize that these are gale force winds to overcome from the long side. Disregarding either a weekly or monthly signal seems dangerous to me. Ignoring coincidental daily, weekly, monthly, and quarterly counts is outright foolish.
In summary, I am the first to argue that there are some tantalizing Biotech companies out there, such as Biomarin (BMRN), Medivation (MDVN), Esperion (ESPR), Seattle Genetics (SGEN) and Vertex Pharma (VRTX). These stocks may eventually bloom into megacaps, but just as the most recent multi-year rising tide has floated all boats, the rip-tide will inevitably sink many of them. For my money now is the time to “pair” favorite longs against sector ETF shorts.
Follow Fil on Twitter: @FZucchi
Author has positions in IBB, BMRN, VRTX, MDVN, and SGEN at the time of publication. Any opinions expressed herein are solely those of the author, and do not in any way represent the views or opinions of any other person or entity.


 Ready To Break Out?")

")

