 United Nations could delay action. President Obama and Secretary of State John Kerry are finding it difficult to rally international support for a military operation in Syria. It is possible a strike could be pushed out until after the United Nations concludes their upcoming meeting. From Bloomberg:
 Obama now faces a timeline that may delay until next month — after the seven-day opening of general debate at the United Nations General Assembly in New York that starts Sept. 24 — an attack that he has said would be “limited in duration and scope” to punish the Syrian government and to reinforce an international norm against “heinous acts.”
Payrolls Cloud Tapering Waters
At face value, Friday’s employment report seemed to come in near market expectations. However, as noted by the Wall Street Journal, the revisions make reading the Fed tea leaves much more difficult:
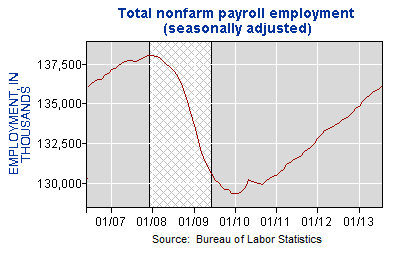
From Wall Street Journal: WASHINGTON—Employers added 169,000 jobs in August while payroll gains in prior months were revised sharply lower, signaling slower momentum in the labor-market recovery and complicating the Federal Reserve’s plans to start dialing back its support for the economy.
Window of Uncertainty
Our market model tracks observable evidence to monitor the ongoing battle between the tolerance for risk and the aversion to risk. Therefore, we do not make asset allocation decisions based on market forecasts, nor do we recommend it. However, understanding the range of probabilistic outcomes is always a healthy exercise to remain as unbiased as humanly possible. The charts have had a bearish bias in recent weeks. Looking at more bullish scenarios allows us to see a broader range of possible outcomes for stocks.
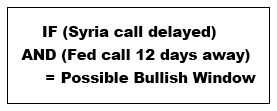
One bullish scenario for stocks considers the delay in the decision process relative to Syria and the fact that the next Fed statement is still almost two weeks away. Friday’s employment revisions, which showed weaker than previously reported progress, could lead market participants to believe the Fed will postpone their widely-anticipated September tapering announcement. Regardless of what the Fed does or does not do on September 18, what will drive markets over the next twelve days is the market’s expectations of upcoming Fed action, or lack thereof.
Fed Has Laid Out Tapering Case
 Fed governors have been consistently reading from the September tapering script for over three months. The FOMC has been very deliberate in attempting to prepare markets for a reduction in their monthly bond purchases. All things being equal, the Fed would prefer not to have to start over on the “preparing the markets” front. Therefore, unless the Fed adopts a new script for public comments, we continue to believe the base case is for the Fed to stick to the tapering schedule. From Reuters/Fox News:
The U.S. Federal Reserve can begin winding down its bond-buying stimulus later this year as the economy improves, but will likely need to keep official interest rates near zero for another two years, Chicago Fed President Charles Evans said on Friday. While Evans did not specify an exact month for the start of a reduction in the Fed’s purchases of mortgage and Treasury bonds, his timeline appears to make him reticent about making such a move in September, as most investors now expect.
Investment Implications – Flexibility Required
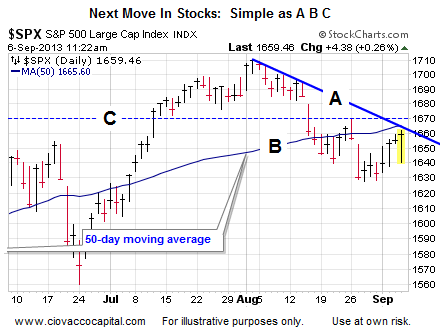
The daily and weekly charts for the S&P 500 are painting a mixed picture. From a weekly perspective, a bullish breakout appears to be taking place. Our discussion of how to identify trend changes explains the possible significance of the chart below.
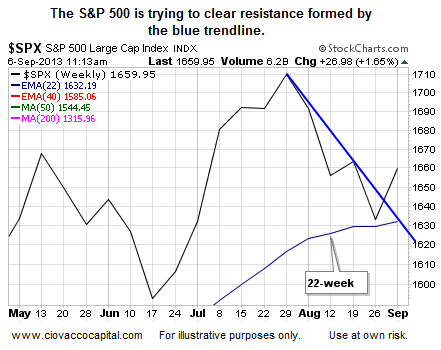
During the trading session Friday, the daily chart was painting a more “possible resistance ahead” picture. How the S&P 500 handles A, B, and C in the chart below will help us assign probabilities to the bullish and bearish cases for stocks. Point A highlights the downward-sloping trendline that defines the current downtrend. Point B identifies the upward-sloping 50-day moving average that traders use to monitor the health of the intermediate-term trend. The dotted line near point C alerts us to the concept of “what once was support, may now act as resistance.” If the market can clear points A, B, and C, a push toward the 1689-to-1732 range on the S&P 500 becomes much more realistic. Conversely, if price is repelled below A, B, and C, the bears will have protected their daily-trend fort.
If you pay attention to what is happening, you will not stray too far from the market’s asset pricing mechanism. That mechanism has said “reduce risk to account for the uncertainty, but do not redeploy your cash into conservative investments yet.” We have done just that by holding about half of our allocation in stocks (SPY) and leading sectors (QQQ), while offsetting the risk with high cash balances. When the markets begin to support the bullish or bearish case with conviction, we will migrate in a manner that allows us to remain in the pricing mechanism’s neighborhood.
Twitter: @CiovaccoCapital @seeitmarket
Position in SPY and QQQ at the time of publication.
Any opinions expressed herein are solely those of the author, and do not in any way represent the views or opinions of any other person or entity.


