
It’s difficult to argue against the opinion that the latest “v-bottom” rally in US equities has more force and bullish swagger about it than any market leg higher since at least January 2013. Calling it “bearish” sounds like an absurd contradiction. But is it possible this superficial show of strength – taken in the context of the decline preceding it – is indicative of a more fragile market underneath the surface: one that is more susceptible to larger sell offs, more often?
The balance of the evidence laid out in the historical study below concludes “yes”.
In the 8 trading sessions since Wednesday, October 15’s bottom, the SPDR S&P 500 ETF (SPY) has installed a V-bottom rally with a range exceeding 8%. Following late September-early October’s -9.8% drop the brevity and parabolic angle of SPY’s performance – the shortest, most violent burst higher since Fall 2011 – has elicited a lot of speculation:
Does a rally with these characteristics typically follow a sustained bottom? Or, is it a limited, corrective move that will fizzle and roll over into a retracement that sees the S&P give back some or all of its V-bottom gains?
One way to measure this is to examine SPY’s Rate-of-Change (RoC), a basic technical indicator that evaluates the percentage gain or loss as of a day’s close versus the close X days ago. In the study below, RoC is configured to look backward over the previous 7 trading days. This offers SPY’s net performance over the course of the V-bottom rally (10/15-10/24), and a basis of comparison against which we can measure SPY’s historic performance around a RoC reading that meets or exceeds Friday’s.
The resulting data answers two questions:
- In what market context do rallies like this generally occur?
- How does SPY perform following rallies of this magnitude?
Since January 2000, SPY’s 7-Day Rate-of-Change has met or exceeded Friday’s reading (5.364) on 49 previous occurrences.
The period in which these occur, the total rise from the local low to high, the rise after a RoC meeting/exceeding 5.364 (like Friday’s) and any subsequent decline (measured from the high, in trading days) are laid out here:
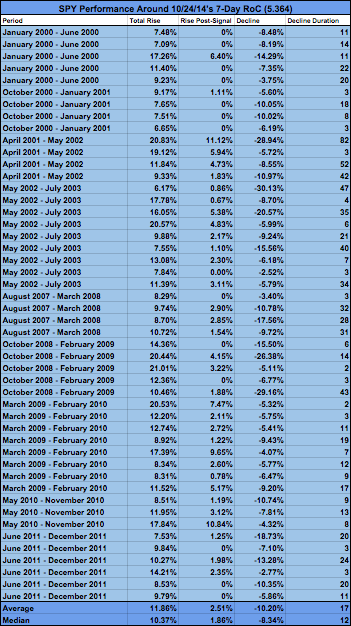
Breaking down the table (RoC is based on closing data, not intraday extremes):
- The average total rise in which these RoC reading occur is 11.86%; Median 10.37%. Comparing this to October 2014’s 8.01% (low-to-high), we see the current rally is actually on the modest side.
- The average rally from the close on the day a RoC meeting/exceeding 5.364 prints is 2.51%, median 1.86%. This is the baseline performance against which any rally this week (of 10/27/2014) should be measured.
- Following the total rise, SPY has corrected -10.2% on average; median -8.34%. These declines occur over 17 (average) or 12 (median) trading days.
- 46 of 49 (94%) declines retraced the post-signal rise by 100% or more. Of these three exceptions, two occurred in March 2009-February 2010 (71% retraced or -5.32%, 42% retraced or -4.07%) and one in May-November 2010 (40% retraced or -4.32%).
- 12 of 49 (24.5%) saw no “Rise Post-Signal” but immediately entered decline on the following trading day.
- The average and median decline that follows these readings far exceed’s Wednesday, 10/15’s -5.02 reading (lowest since 11/15/2012).
Here’s the hypothetical edge provided by this data:
- Shorting SPY on the close of the “Signal” day where “Signal” = the first close where SPY’s 7-Day RoC =/>5.364 offers 4:1 ratio of reward:risk (or “R”) on average. The median data offers a 4.48R. The data above offers a 94% likelihood that any adverse excursion that occurs where a short is opened at close on the signal day (denoted by the “Rise Post-Signal” column) will be at least 100% retraced.
In what market context do rallies like this generally occur?
Having answered the second question above (“How does SPY perform following rallies of this magnitude?”), let’s turn back to the first: “In what market context do rallies like this generally occur?”
Check out how this data breaks out across time. The full measures of the rallies (“total rise”) in which RoC readings meeting or exceeding Friday’s are in blue; the extent of the rallies left over after the RoC reading occurs is in red; and the subsequent declines are in yellow.
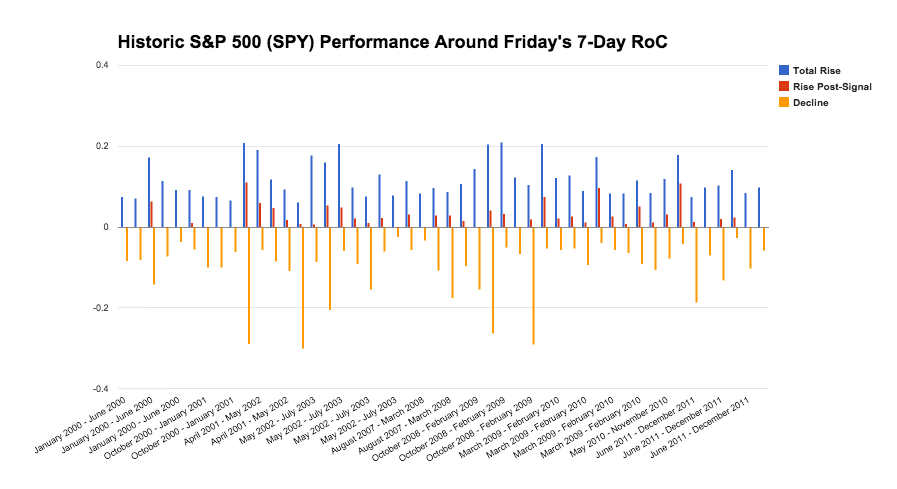
It’s difficult to separate any period since January 2000 from “crisis” (whether “pre” or “post”), but it’s still worth noting that all the largest rallies featuring an 8-day percentage gain (as indicated by RoC) like the 8 ending last Friday, 10/24/2014 occur in 1) bear markets, 2) adverse market environments (Spring 2010, Fall 2011), and 3) in the initial snapback rallies that occur as SPY exits these periods. Moreover, the largest rallies tend to occur in the most dire contexts: 2001-2002, late 2008-early 2009, and Fall 2011, with the only real exception being Fall 2010’s relief rally following Fed Chair Ben Bernanke’s Jackson Hole Speech and its foreshadowing of QE2.
This affirms the view that rallies comparable to the current move tend to occur in the context of larger market declines, and that the volatility seen in October is – believe it or not – on the light side, historically.
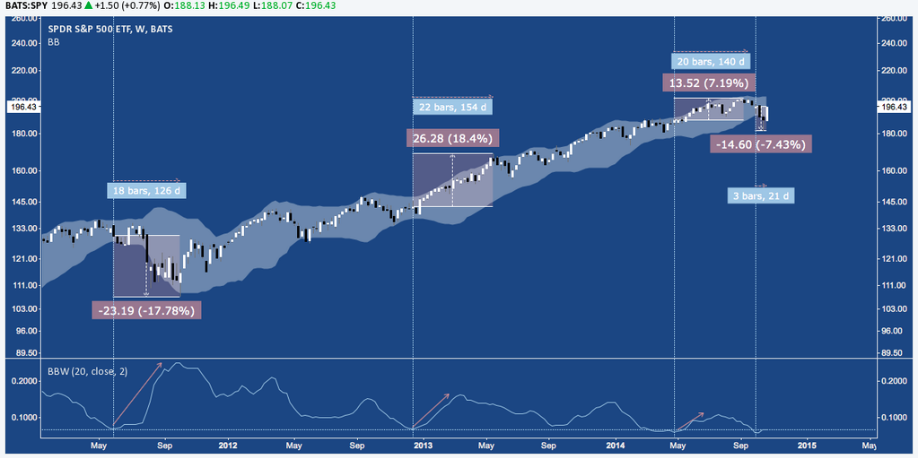
So, is there more volatility ahead? Is SPY going to make a quick exit; or is it just stepping foot into a longer, more adverse market context? Some studies such as this one on NYSE New Highs-New Lows corroborate this. Other observations, such as the tight range compression indicated by SPY’s Bollinger Bands (below) suggests October is a prelude to wider ranges and higher realized volatility in the weeks ahead.
Twitter: @andrewunknown
Kassen holds no exposure to securities/instruments mentioned at the time of publication. Commentary provided in the above text and video is for educational purposes only and in no way constitutes trading or investment advice.


")


