Back in August, I wrote a blog post on Crude Oil showing the “measured move” Crude Oil lower price target as a percentage basis for crude oil prices.
The bottom line is that Crude likes to correct roughly 75% of a previous move. The math is in the blog post hyperlinked above.
And the chart from that post has been updated below:
Crude Oil Prices – Monthly Log Chart
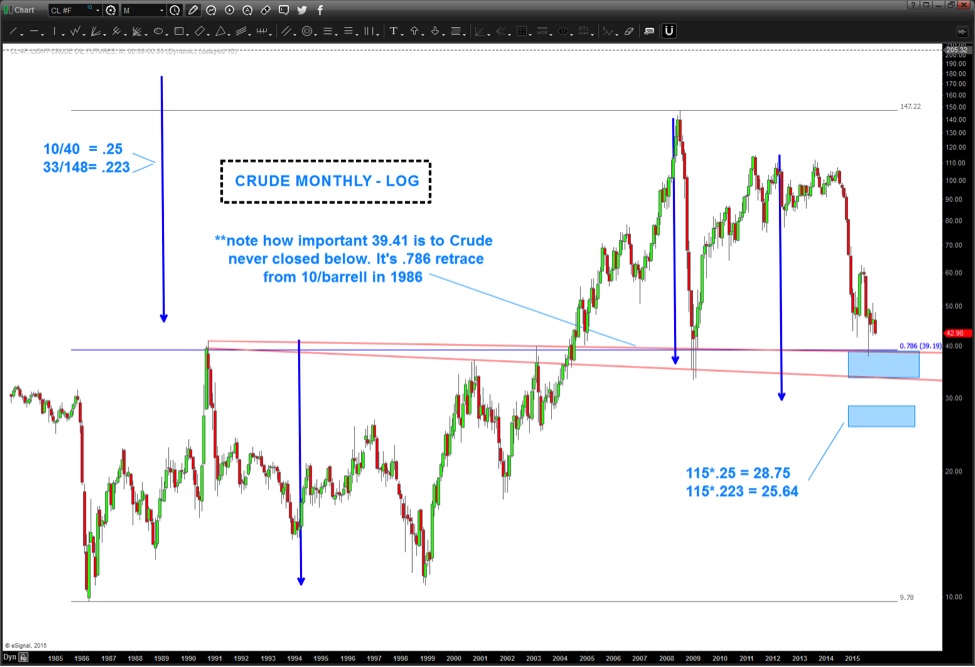
Crude oil prices hit the trend line nicely and bounced from 37.50 to 50 bucks. I see this as a 3 wave move up into 50 but, perhaps, another move higher is needed to complete the pattern? So what is the crude oil lower price target to set up such a move? For me that key level is roughly $40 on crude.
Here’s the pattern showing the key to that level:
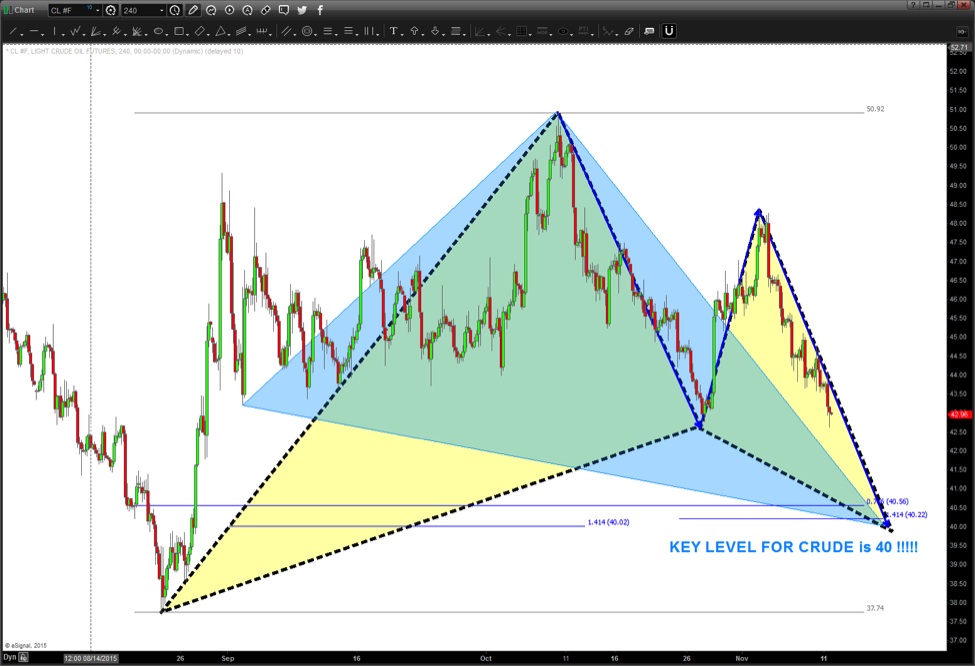
If we lose $40 on Crude Oil then the possibility of another leg down in oil prices is real and the targets shown above (25-28) become a reality.
Thanks for reading and let me know if you have any questions.
Twitter: @BartsCharts
Author does not have a position in mentioned securities at the time of publication. Any opinions expressed herein are solely those of the author, and do not in any way represent the views or opinions of any other person or entity.


 Ready To Break Out?")
 Ready To Break Out?")

")
