Of late, volatility has been volatile.
In the past month, the Volatility Index (VIX) has done a complete round trip – surging 68 percent in 11 sessions and then giving it all back in the next eight. As the fear premium related to Greece and Chinese stocks came out, there was less need to buy protection – at least this is the impression one gets looking at how market participants bid up stocks and bid down volatility.
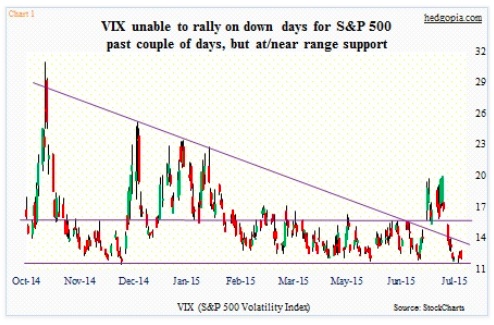
The result was a failed breakout on VIX (Chart 1 above). In late June, the Volatility Index managed to break out of the mid-October 2014 trend line, but has now fallen back below it.
The question is, where to from here?
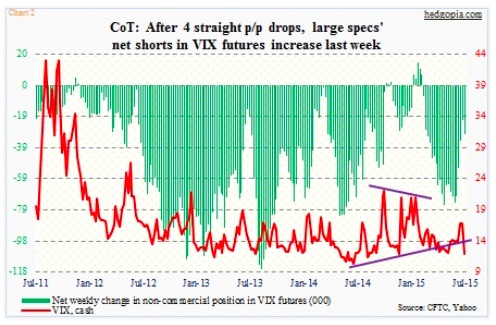
Last week, non-commercials per the COT Report raised net shorts in VIX futures after four consecutive period-over-period drops (Chart 2 below). They got the direction right. The VIX closed at 13.37 on Tuesday last week, before dropping to 11.71 intra-day on this Monday. It will be interesting to see how these traders were positioned by Tuesday this week. Cot Report holdings will be released tomorrow – and we’ll cover it here this weekend.
In the meantime, the spot VIX is at/near support.
Referring to Chart 1 again, with the passing of each day, the distance between the trend line and the horizontal support continues to narrow. The moment of truth could be near. There can either be a breakout or a breakdown. Stocks should like the latter scenario. But what are the odds of that happening?
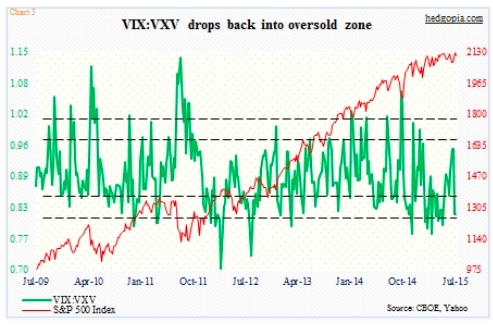
First off, near-term momentum indicators on the S&P 500 Index, for instance, are overbought, and could very well be in the process of unwinding. Concurrently, the ratio of VIX to VXV is in oversold zone. As shown in Chart 3 above, a rise in the ratio tends to put stocks under pressure. The idea is that when VXV, which measures three-month implied volatility on the S&P 500, is higher than on VIX, which measures one-month volatility, demand for short-term volatility is less than for longer-term. The steeper the contango, the lower the ratio, and the higher the odds it gets unwound.
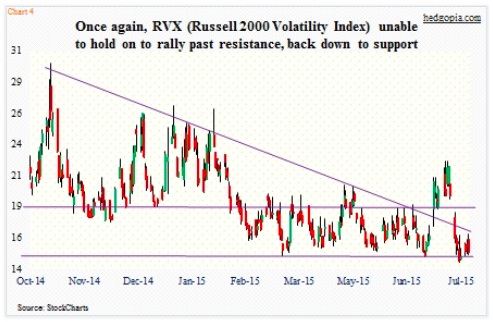
In this regard, small-caps have the potential to be a telltale. It is a good way to find out investor proclivity for risk-on. Most recently, the Russell 2000 Index peaked on the 16th, two sessions before the S&P 500 did. Unlike the S&P 500, The Russell 2000 is already testing its 50-day moving average. So far, the test has been successful. And the Russell 2000 Volatility Index (RVX) is struggling to get off support. Similar to VIX, RVX’s rally attempts have been stopped by that mid-October 2014 trend line, and it is at/near the lower end of range (Chart 4 above).
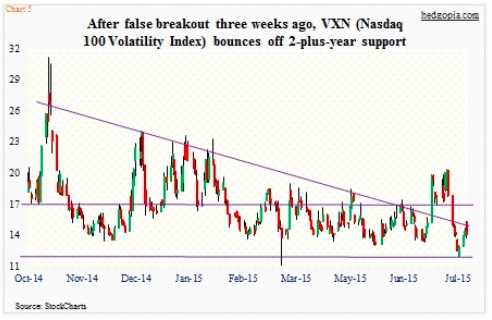
This is also true with VXN, the Nasdaq 100 Volatility Index (VXN) – see Chart 5 above. Heading into yesterday’s session, it has had three strong sessions, and tried to build on that momentum yesterday, but failed at that trend line (as well as its 50-day moving average). Support goes back to March 2013. Similarly, the past couple of sessions, VIX has been unable to rally on days when the S&P 500 has gone down.
Apart from that, all these three volatility indices – VIX, RVX and VXN – have a similar look to them, are at/near support and suffered false breakouts three weeks ago. And all are approaching inflection points. As things stand now, the odds of a breakout look better than of a breakdown. The only question is of sustainability and duration. The breakout on the volatility index three weeks ago was sharp. As was the retreat.
Thanks for reading!
Twitter: @hedgopia
Read more from Paban on his blog.
No position in any of the mentioned securities at the time of publication. Any opinions expressed herein are solely those of the author, and do not in any way represent the views or opinions of any other person or entity.


