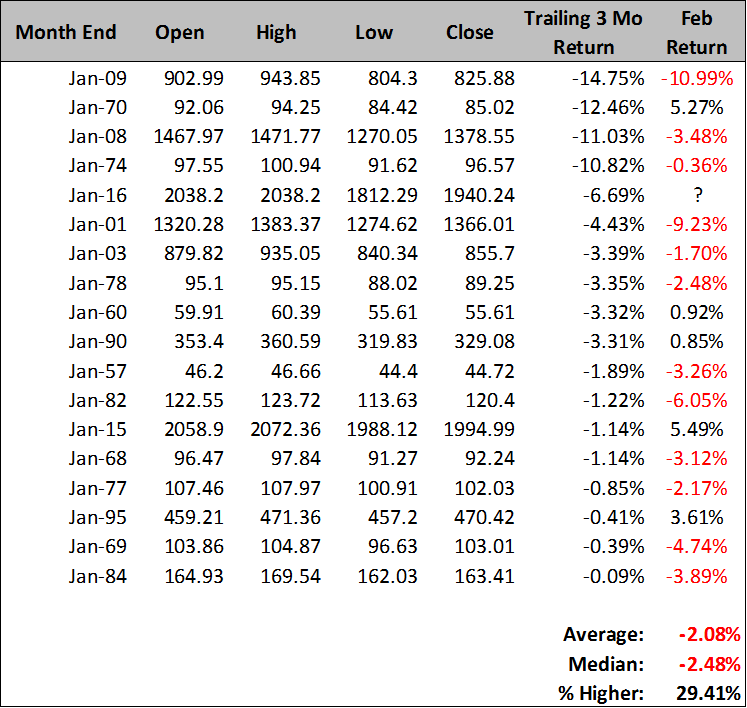
We enter February with a negative trailing three month return (-6.69%). Since 1950, when we enter February with a negative trailing three-month return on the S&P 500, February is positive just 29% of the time with average returns of -2.09%. While February of 2015 bucked the trend gaining an impressive 5.49%, is it prudent to expect 2016 to be a second consecutive outlier?
If we add a trend overlay that’s when things get even more bearish for stocks. Since 1950, when the month of January closes below its 20-month simple moving average, and the trailing three-month return is negative from 11/1-1/31, February is higher 11% of the time (1 of 9 instances) for average returns of -3.59%. This suggests that while we may see February trade up toward and above the 2,000 mark, we may also see the month close in the red. That would mark a rather exciting inside month, which was exactly what occurred in February of 2008. There’s that 2008 stock market parallel again…
Secondly, using the same setup described above, which is the month of January closes below its 20-month simple moving average, and the trailing three-month return is negative from 11/1-1/31, we can identify the historical behavior of the S&P 500 over the full calendar year. The calendar year return averages -8.63% with a median return of -12.71%. While this isn’t overly bearish, the average calendar year drawdown is. On average the S&P 500 trades down an additional -21.04% from January’s close with 100% of the calendar years trading below January’s close at some point during the remainder of the year. This data leaves a bearish bias to potential stock market returns in 2016.
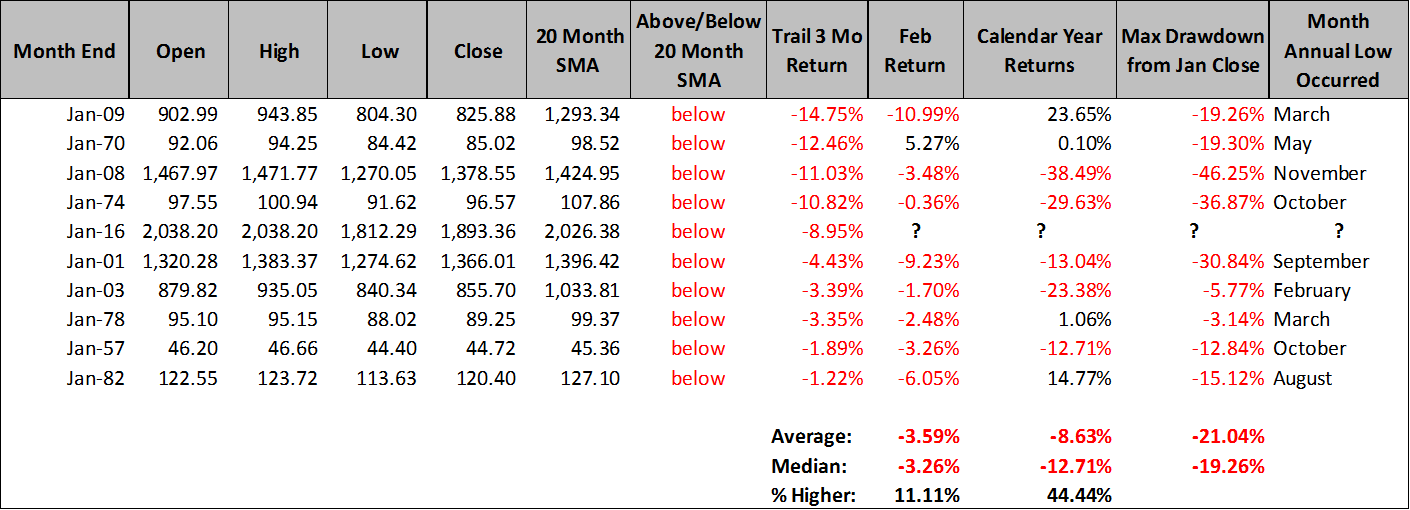
This would target 2016’s low at ~1,532 before setting the stage for a possible year-end rally. From a long-term chart perspective, retesting horizontal support through both the 2000 and 2007 peaks would appear perfectly normal and healthy. Of course some might argue that 2016 more closely resembles 2008 or 2001 and in those years the S&P 500 traded down an additional -46.25% and -30.84% from January’s close. Should that unfold in 2016 the S&P 500 would be trading at ~1,192 at some point during this year. I’m not willing to be that bearish on stocks, but anything’s always possible.
What should an investor do? Easy, run your defense onto the field. Investors have been making hay while the sun shines for 7 years. It’s now time to step inside to stay safe from a potential storm that may be rolling into town. Bear Markets have a way of making the most aggressive investors wish they were conservative investors – after they’ve experienced meaningful loss. A tactical portfolio rebalance to underweight equities and overweight cash or cash equivalents may be the most prudent and proactive step to prepare your portfolio to weather the storm – before you’ve experience meaningful loss. Conversely, if it turns out the storm clouds clear, and the sunshine returns, you could rely on one of Meb Faber’s favorite tactics to rotate back toward a normalized equity allocation within your portfolio’s composition – a monthly close above the 12-month simple moving average. A certain plan of this nature can help you successfully navigate the markets uncertainty.
Thanks for reading.
Further reading from Steve: Portfolio Diversification – Why It’s Time To Challenge Conventional Wisdom
Twitter: @SJD10304
Any opinions expressed herein are solely those of the author, and do not in any way represent the views or opinions of any other person or entity.
 Ready To Break Out?")


 Rolling Over At Key Fibonacci Level?")

 Ready To Break Out?")