On Thursday, the S&P 500 dropped 1.18%, ending its streak of days without a 1% move (up or down) at 62 days in a row. While this streak was significant and worthy of my attention (check out my Tumblr blog), something else occurred that day that caught my eye: the Volatility Index (VIX) spiked.
In this piece I want to take a closer look at the VIX and market performance post VIX spikes.
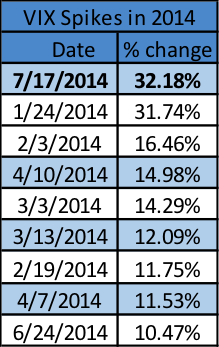
On Thursday, the VIX soared 32.18%, making it the biggest move so far in 2014.
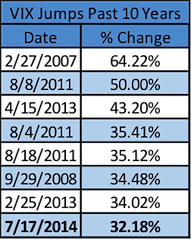
Going back further, it was the 8th biggest VIX spike over the past decade.
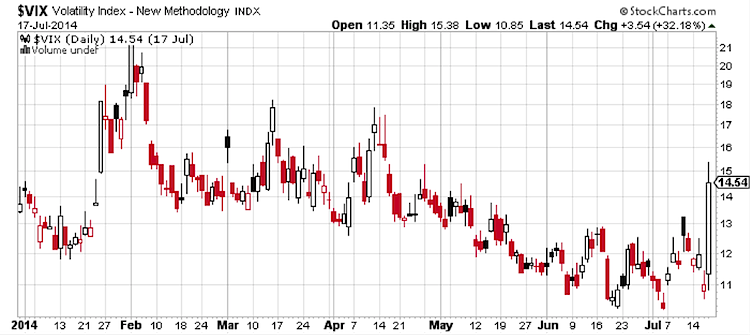
Now take a second and look at it on a chart, this was definitely a big move no matter how you view it.
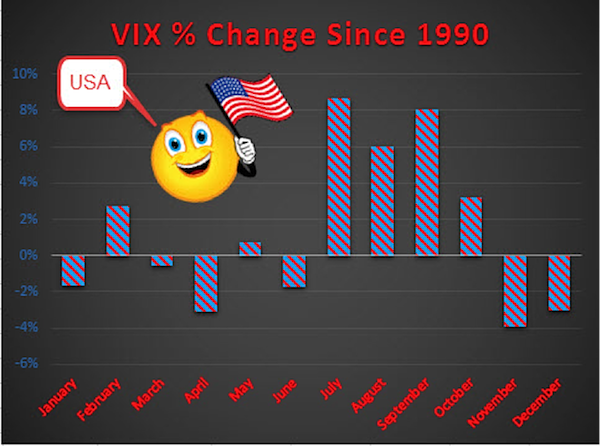
What is interesting is July is actually a month we’ve seen this before. At the start of the month, I noted July was the most bullish month on average for the VIX, so this big move higher shouldn’t come as a complete surprise.
As I always like to do, let’s break it down and see what we find. Others might say “the VIX was up a lot the other day” and leave it at that. I’d rather take some extra steps to see what it might mean.
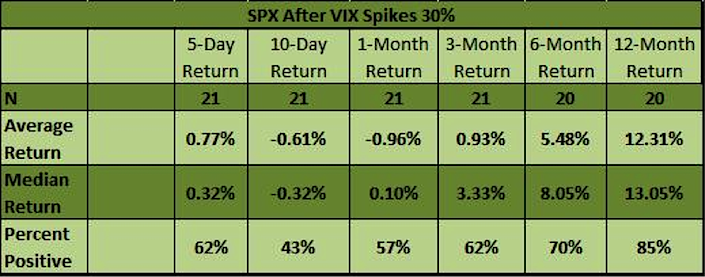
Going back to 1990, this was the 22nd time the VIX was up >30%. Looking at the S&P 500 returns after these VIX spikes shows a market down about a percent a month later and up just a percent 3-months later. So near-term I’d have to say that SPX moves are more muted, definitely not near-term bullish. Going out 6- and 12-months, things seem to get back to normal.
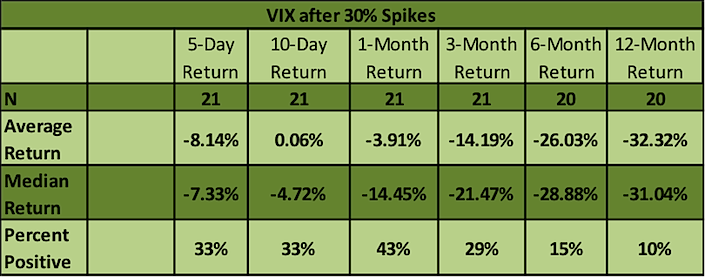
What does the VIX do after these huge one day moves? My initial guess was it drops. The reason being the VIX is a mean-reverting instrument most of the time. Look at the past five years, we’ve seen VIX spikes many times, but in every case a few months later it comes right back down. Sure enough, the results here show a lower VIX should be expected in early all time-frames. The one that really stood out is there’s just a 10% chance the VIX will be higher a year from now. Wow.
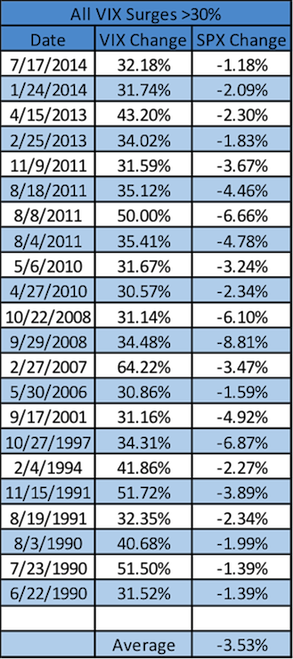
This is really interesting. Looking at all 22 of the 30% VIX spikes going back to 1990, the recent S&P 500 drop of 1.18% was actually the smallest SPX drop ever! In fact, the average S&P 500 drop is 3.53%.
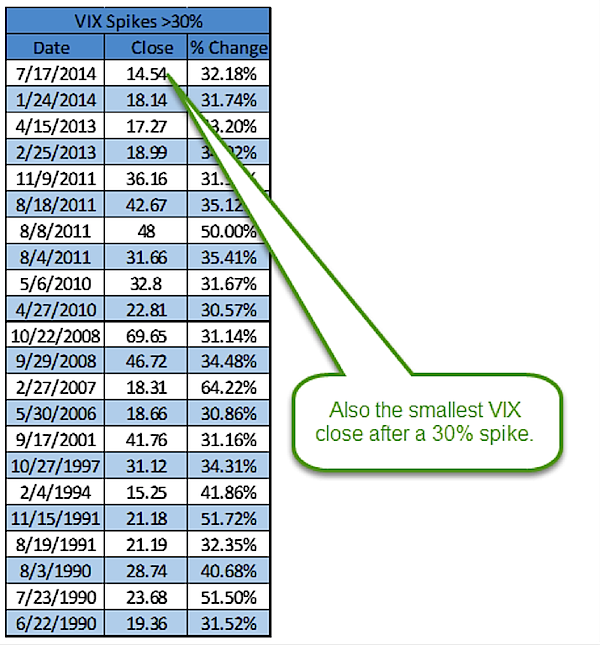
What could that mean? Was Thursday some special day and does it mean anything? Well, I hate to make it this simple, but yesterday was also the lowest VIX close out of all 22 occurrences. So the fact we also had the lowest SPX drop ever really isn’t that surprising. In fact, you’d expect it.
So there you go. I still think we’re in a bull market, but we’ll continue to see short-term dips and spikes in fear. When it comes to the VIX, it is fun to talk about big % moves, but it really isn’t a true apples-to-apples comparison. The reality is the VIX should be used in absolute move terms, not percentages. Still, big moves like this do suggest a flattish market the next few months. Thanks for reading and good luck out there.
No position in any of the mentioned securities at the time of publication. Any opinions expressed herein are solely those of the author, and do not in any way represent the views or opinions of any other person or entity.
")


